Abstract
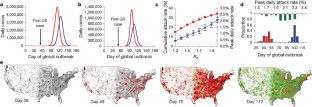
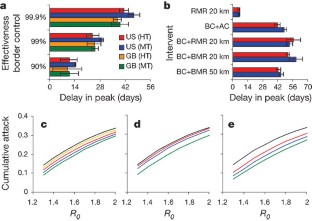
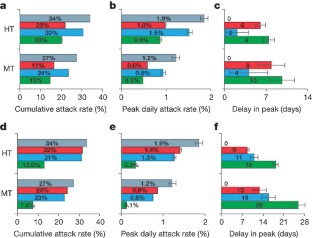
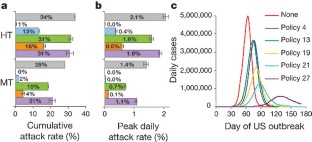
Development of strategies for mitigating the severity of a new influenza pandemic is now a top global public health priority. Influenza prevention and containment strategies can be considered under the broad categories of antiviral, vaccine and non-pharmaceutical (case isolation, household quarantine, school or workplace closure, restrictions on travel) measures1. Mathematical models are powerful tools for exploring this complex landscape of intervention strategies and quantifying the potential costs and benefits of different options2,3,4,5. Here we use a large-scale epidemic simulation6 to examine intervention options should initial containment6,7 of a novel influenza outbreak fail, using Great Britain and the United States as examples. We find that border restrictions and/or internal travel restrictions are unlikely to delay spread by more than 2–3 weeks unless more than 99% effective. School closure during the peak of a pandemic can reduce peak attack rates by up to 40%, but has little impact on overall attack rates, whereas case isolation or household quarantine could have a significant impact, if feasible. Treatment of clinical cases can reduce transmission, but only if antivirals are given within a day of symptoms starting. Given enough drugs for 50% of the population, household-based prophylaxis coupled with reactive school closure could reduce clinical attack rates by 40–50%. More widespread prophylaxis would be even more logistically challenging but might reduce attack rates by over 75%. Vaccine stockpiled in advance of a pandemic could significantly reduce attack rates even if of low efficacy. Estimates of policy effectiveness will change if the characteristics of a future pandemic strain differ substantially from those seen in past pandemics.
This is a preview of subscription content, access via your institution
Access options
Access to this article via ICE Institution of Civil Engineers is not available.
Subscribe to this journal
Receive 51 print issues and online access
$199.00 per year
only $3.90 per issue
Buy this article
- Purchase on SpringerLink
- Instant access to full article PDF
Prices may be subject to local taxes which are calculated during checkout


References
World Health Organisation. WHO global influenza preparedness plan. http://www.who.int/csr/resources/publications/influenza/GIP_2005_5Eweb.pdf (2005).
Ferguson, N. M., Donnelly, C. A. & Anderson, R. M. Transmission intensity and impact of control policies on the foot and mouth epidemic in Great Britain. Nature 413, 542–548 (2001)
Keeling, M. J. et al. Dynamics of the 2001 UK foot and mouth epidemic: stochastic dispersal in a heterogeneous landscape. Science 294, 813–817 (2001)
Riley, S. et al. Transmission dynamics of the etiological agent of SARS in Hong Kong: Impact of public health interventions. Science 300, 1961–1966 (2003)
Lipsitch, M. et al. Transmission dynamics and control of severe acute respiratory syndrome. Science 300, 1966–1970 (2003)
Ferguson, N. M. et al. Strategies for containing an emerging influenza pandemic in Southeast Asia. Nature 437, 209–214 (2005)
Longini, I. M. Jr et al. Containing pandemic influenza at the source. Science 309, 1083–1087 (2005)
Oakridge National Laboratory. Landscan global population data. http://www.ornl.gov/sci/gist/landscan (2003).
Anderson, R. M. & May, R. M. Infectious Diseases of Humans; Dynamics and Control (Oxford Univ. Press, Oxford, 1991)
Chotpitayasunondh, T. et al. Human disease from influenza A (H5N1), Thailand, 2004. Emerg. Infect. Dis. 11, 201–209 (2005)
The Writing Committee of the WHO Consultation on Human Influenza A/H5N1. Current concepts—Avian influenza A (H5N1) infection in humans. N. Engl. J. Med. 353, 1374–1385 (2005)
World Health Organisation Writing Group. Non-pharmaceutical interventions for pandemic influenza, national and community measures. Emerg. Infect. Dis. 12, 88–94 (2006)
Lo, J. Y. et al. Respiratory infections during SARS outbreak, Hong Kong, 2003. Emerg. Infect. Dis. 11, 1738–1741 (2005)
Bell, D. M. Public health interventions and SARS spread, 2003. Emerg. Infect. Dis. 10, 1900–1906 (2004)
Hufnagel, L., Brockmann, D. & Geisel, T. Forecast and control of epidemics in a globalized world. Proc. Natl Acad. Sci. USA 101, 15124–15129 (2004)
World Health Organisation Writing Group, Non-pharmaceutical interventions for pandemic influenza, international measures. Emerg. Infect. Dis. 12, 81–87 (2006)
Hong Kong International Airport. http://www.hongkongairport.com/eng/aboutus/statistics.html (2003).
Gani, R. et al. Potential impact of antiviral drug use during influenza pandemic. Emerg. Infect. Dis. 11, 1355–1362 (2005)
Coombes, R. UK stocks up on antiviral drug to tackle flu outbreak. Br. Med. J. 330, 495 (2005)
Ferguson, N. M., Mallett, S., Jackson, H., Roberts, N. & Ward, P. A population-dynamic model for evaluating the potential spread of drug-resistant influenza virus infections during community-based use of antivirals. J. Antimicrob. Chemother. 51, 977–990 (2003)
Longini, I. M. J., Koopman, J. S., Monto, A. S. & Fox, J. P. Estimating household and community transmission parameters for influenza. Am. J. Epidemiol. 115, 736–751 (1982)
Cauchemez, S., Carrat, F., Viboud, C., Valleron, A. J. & Boelle, P. Y. A. Bayesian MCMC approach to study transmission of influenza: application to household longitudinal data. Stat. Med. 23, 3469–3487 (2004)
Ferguson, N. M. et al. Planning for smallpox outbreaks. Nature 425, 681–685 (2003)
Ferguson, N. M., Fraser, C., Donnelly, C. A., Ghani, A. C. & Anderson, R. M. Public health risk from the avian H5N1 influenza epidemic. Science 304, 968–969 (2004)
Acknowledgements
We thank the National Institute of General Medical Sciences MIDAS Program (N.M.F., D.A.T.C. and D.S.B.), the Medical Research Council (N.M.F.), the Royal Society (N.M.F. and C.F.) and the Howard Hughes Medical Institute (N.M.F.) for research funding. We thank B. Schwartz, R. Robinson, B. Gellin, D. Harper, J. Edmunds, P. Grove, R. Hatchett and members of the MIDAS consortium for useful discussions. We also thank the National Center for Supercomputing Applications (NCSA) and the MIDAS informatics group for computational resources and technical advice. Author Contributions N.M.F. designed, implemented and ran the model, integrated the demographic and disease data sets used, and drafted and revised the text. All other authors edited or commented on the text. D.C. identified, collated and processed some demographic and travel data sets used and provided input on model assumptions. C.F. performed analytical modelling that aided the verification of the simulation and gave suggestions on model parameterization. J.C.C. assisted with the collation of demographic and travel data sets. P.C.C. assisted with provision of high performance computing facilities and technical advice. D.S.B. provided input into model design and assumptions, advised on the presentation of results and assisted with data collection.
Author information
Authors and Affiliations
Corresponding author
Ethics declarations
Competing interests
Reprints and permissions information is available at npg.nature.com/reprintsandpermissions. The authors declare no competing financial interests.
Supplementary information
Supplementary Notes
This file contains information on datasets and modelling methods used, model parameterization and sensitivity analyses. (PDF 847 kb)
Supplementary Video 1
This file shows the first 140 days of a pandemic in Great Britain, assuming a moderate level of transmissibility (R0=1.7). The movie starts on day 40 of the global pandemic, just before the first cases entering the country. The video runs at the rate of three days model time per second of video time. Grey scale represents population density of uninfected, susceptible individuals. Red represents density of infected individuals, and green represents areas where the epidemic is over. 58.1 million individuals were modelled in the GB simulation. (AVI 24623 kb)
Supplementary Video 2
This file shows the first 170 days of a pandemic in the United States of America, assuming a moderate level of transmissibility (R0=1.7). The movie starts on day 40 of the global pandemic, just prior to the first cases entering the country. The video runs at the rate of three days model time per second of video time. Grey scale represents population density of uninfected, susceptible individuals. Red represents density of infected individuals, and green represents areas where the epidemic is over. 300 million individuals were modelled in the US simulation. (AVI 27934 kb)
Rights and permissions
About this article
Cite this article
Ferguson, N., Cummings, D., Fraser, C. et al. Strategies for mitigating an influenza pandemic. Nature 442, 448–452 (2006). https://doi.org/10.1038/nature04795
Received:
Accepted:
Published:
Issue Date:
DOI: https://doi.org/10.1038/nature04795
This article is cited by
-
ePyDGGA: automatic configuration for fitting epidemic curves
Scientific Reports (2024)
-
Predicting seasonal influenza outbreaks with regime shift-informed dynamics for improved public health preparedness
Scientific Reports (2024)
-
Biased versus unbiased numerical methods for stochastic simulations
Communications Physics (2024)
-
Confidence in Covid-19 models
Synthese (2024)
-
Household Influenza Transmission and Healthcare Resource Utilization Among Patients Treated with Baloxavir vs Oseltamivir: A United States Outpatient Prospective Survey
Infectious Diseases and Therapy (2024)


