Linear Regression Algorithm
What is Linear Regression?
Linear Regression is a supervised machine learning algorithm used to predict continuous numerical values by establishing a linear relationship between independent variables (features) and a dependent variable (target).
Example
Predicting:
- House Prices
- Student Exam Scores
- Sales Revenue
- Temperature Forecasts
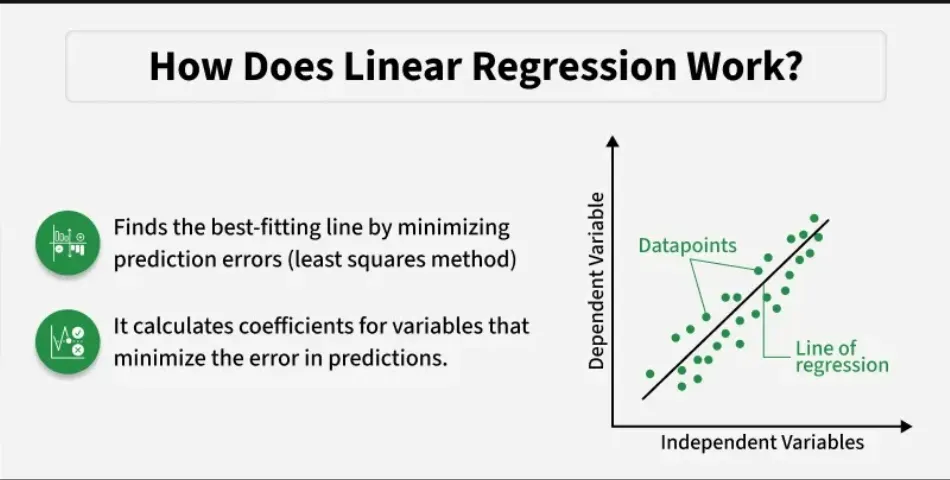
The algorithm attempts to fit the best straight line through the data points.
Image 1: Introduction to Linear Regression
Explanation
The image illustrates a scatter plot where data points represent observations and the straight line represents the best-fit regression line used for prediction.
Why Do We Need Linear Regression?
Businesses and organizations often need to forecast future outcomes.
Examples
- Predict future sales
- Estimate property prices
- Forecast stock market trends
- Predict student performance
Linear Regression helps identify patterns and relationships within data.
Image 2: Real World Prediction Examples
Explanation
These examples demonstrate how Linear Regression is applied to predict future outcomes based on historical data.
Understanding the Regression Line
The regression line is the line that best represents the relationship between variables.
Equation
Y=mX+cY = mX + cY=mX+c
Where:
- Y = Predicted value
- X = Input feature
- m = Slope
- c = Intercept
The algorithm finds the best values of m and c that minimize prediction errors.
Image 3: Regression Line Equation
Explanation
The image shows how the slope and intercept determine the position and direction of the regression line.
How Linear Regression Works
The algorithm follows these steps:
Step 1
Collect training data.
Step 2
Plot data points.
Step 3
Find the best-fit line.
Step 4
Calculate prediction errors.
Step 5
Optimize the line to minimize errors.
Image 4: Linear Regression Workflow
Explanation
The workflow demonstrates how data is transformed into predictions using Linear Regression.
Cost Function in Linear Regression
The goal is to minimize prediction errors.
The Cost Function measures how far predictions are from actual values.
Mean Squared Error (MSE)
MSE=1n∑(y−y^)2MSE = \frac{1}{n}\sum(y-\hat y)²MSE=n1∑(y−y^)2
A lower MSE indicates better model performance.
Image 5: Cost Function Visualization
Explanation
The image shows how prediction errors are calculated and minimized during training.
Gradient Descent Optimization
Gradient Descent is used to find the optimal values of slope and intercept.
Process
- Start with random values.
- Calculate error.
- Update parameters.
- Repeat until minimum error is reached.
Image 6: Gradient Descent
Explanation
The image illustrates how Gradient Descent gradually moves toward the lowest error point.
Types of Linear Regression
1. Simple Linear Regression
Uses one independent variable.
Example
Predicting salary based on years of experience.
Image 7: Simple Linear Regression
Explanation
The graph demonstrates a single feature influencing the target variable.
2. Multiple Linear Regression
Uses multiple independent variables.
Example
Predicting house price using:
- Area
- Bedrooms
- Location
- Age of House
Equation:
Get Abhinayaa’s stories in your inbox
Join Medium for free to get updates from this writer.
Y=b0+b1X1+b2X2+…+bnXnY = b_0 + b_1X_1 + b_2X_2 + … + b_nX_nY=b0+b1X1+b2X2+…+bnXn
Image 8: Multiple Linear Regression
Explanation
The image illustrates how multiple factors contribute to a single prediction.
Assumptions of Linear Regression
For optimal performance, Linear Regression assumes:
1. Linearity
Relationship between variables is linear.
2. Independence
Observations are independent.
3. Homoscedasticity
Variance of errors remains constant.
4. Normal Distribution
Residuals follow a normal distribution.
5. No Multicollinearity
Features should not be highly correlated.
Image 9: Linear Regression Assumptions
Explanation
The infographic summarizes the key assumptions required for reliable predictions.
Evaluating Linear Regression Models
Several metrics help measure model performance.
Mean Absolute Error (MAE)
Average absolute difference between actual and predicted values.
Mean Squared Error (MSE)
Average squared error.
Root Mean Squared Error (RMSE)
Square root of MSE.
R-Squared (R²)
Measures how well the model explains data variability.
Image 10: Regression Evaluation Metrics
Explanation
The image compares commonly used regression evaluation metrics.
Linear Regression Implementation in Python
from sklearn.linear_model import LinearRegressionmodel = LinearRegression()model.fit(X_train, y_train)predictions = model.predict(X_test)print(predictions)
Image 11: Linear Regression in Python
Explanation
This image demonstrates how Linear Regression can be implemented using Scikit-Learn.
Advantages of Linear Regression
✔ Simple and Easy to Understand
Suitable for beginners.
✔ Fast Training
Works efficiently on small and medium datasets.
✔ Highly Interpretable
Easy to explain predictions.
✔ Strong Statistical Foundation
Widely accepted in research and industry.
Image 12: Advantages of Linear Regression
Explanation
The infographic highlights why Linear Regression remains one of the most popular algorithms.
Limitations of Linear Regression
✖ Assumes Linear Relationships
Cannot model complex patterns effectively.
✖ Sensitive to Outliers
Extreme values can distort predictions.
✖ Requires Assumptions
Violations may reduce accuracy.
✖ Limited for Non-Linear Data
Advanced algorithms may perform better.
Image 13: Limitations of Linear Regression
Explanation
The image demonstrates situations where Linear Regression may struggle to provide accurate predictions.
Real-World Applications
Healthcare
Disease progression prediction.
Finance
Stock price forecasting.
Real Estate
House price estimation.
Marketing
Sales prediction.
Education
Student performance analysis.
Image 14: Real World Applications
Explanation
These examples show how Linear Regression is used across industries to solve business problems.
Conclusion
Linear Regression is one of the most important algorithms in Machine Learning and serves as the foundation for many advanced predictive models. It helps establish relationships between variables and enables accurate forecasting of continuous values.
By understanding concepts such as regression lines, cost functions, gradient descent, assumptions, and evaluation metrics, data scientists can build reliable and interpretable predictive models.
Key Takeaways
✔ Linear Regression predicts continuous numerical values.
✔ It finds the best-fit line through data points.
✔ Gradient Descent minimizes prediction errors.
✔ MSE, RMSE, MAE, and R² evaluate model performance.
✔ It is widely used in healthcare, finance, marketing, and real estate.