From Noise to Clarity | Track 12
Seeing Relationships Instead of Things #8
Systems Thinking Through Visual Thinking | Post 8 of 30 (The Parts)


Before you read: picture a map or chart you already rely on at work. Does it show you the things involved, the relationships between them, or both.
The org chart that explained nothing
A technology client once handed me an org chart before our first working session together, clearly proud of how tidy it looked. Every team sat inside its own labelled box, reporting lines drawn cleanly upward, no overlaps, no ambiguity. She told me this chart was the clearest picture the company had of how the business actually worked. I asked her a simple question in return. Looking only at this chart, could she tell me why a customer request submitted on a Monday sometimes reached a customer by Wednesday and sometimes took three weeks. She paused for a long moment and admitted the chart could not tell her that at all.
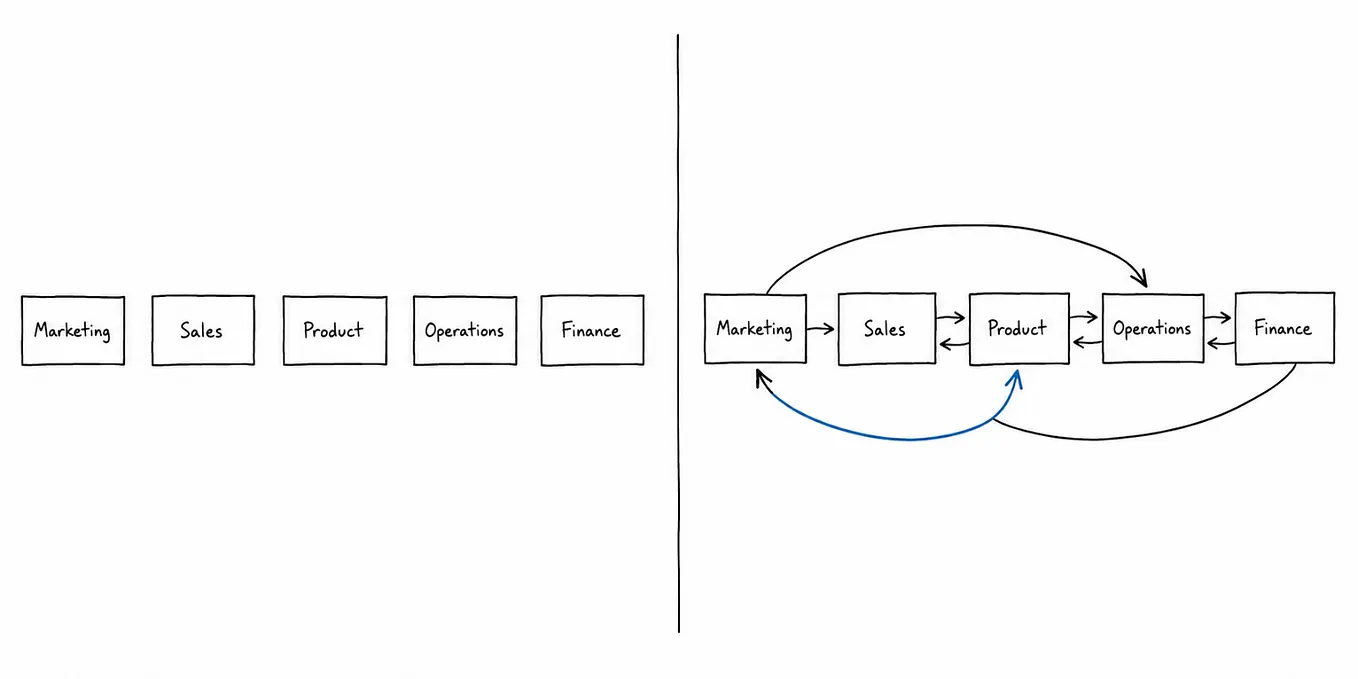
The chart was not wrong, exactly. Every box on it was accurate. Every reporting line existed. What the chart could not show, because it was never built to show it, was how those boxes actually behaved towards each other once a real request started moving through them. Which teams handed things off quickly. Which teams sat on a request for days before anyone noticed. Which two boxes, despite sitting far apart on the page, actually depended on each other constantly in practice. The chart was a complete map of the things. It said almost nothing about the relationships between them.
This is the shift this post asks you to make, and it is a genuine shift rather than an addition, because it changes what you look at first rather than simply adding one more thing to notice. A list of things, however accurate, will never explain a pattern of behaviour on its own. Patterns live in the connections between things, in how fast information moves, in who waits on whom, in which relationship is carrying more weight than the org chart ever suggested it should.
I want to be careful not to overstate the case against maps of things, because they still matter. Knowing which department exists, who reports to whom and where a particular decision formally sits is genuinely useful information, and no amount of relationship mapping replaces the need for that basic clarity. The point is not that things do not matter. It is that a map of things alone creates an illusion of completeness that a map of relationships is far less likely to offer, because a relationship map, done honestly, tends to reveal its own gaps rather than papering over them.

“An org chart tells you what exists. It rarely tells you what actually happens between the things that exist.”
Why things are easier to draw than relationships
There is a plain reason most maps default to things rather than relationships, and it has nothing to do with laziness. Things are stable and countable. A department exists or it does not. A role is filled or it is vacant. Relationships, by contrast, are dynamic, changing week to week depending on workload, trust, urgency and a dozen other factors that resist being pinned neatly onto a static page. It is simply easier to draw a box than to draw the shifting, often invisible current running between two boxes.
This ease has a cost that rarely gets named directly. A team that has only ever mapped its things develops a confidence about its own operation that the relationships underneath do not actually support. The technology client’s org chart genuinely was clear and accurate, and that clarity created a false sense that the business itself was equally well understood, when in fact the chart had quietly left out the entire layer where delays, misunderstandings and quiet dependencies actually lived.
I think this false confidence is worth naming precisely, because it does not feel like ignorance from the inside. It feels, if anything, like competence. A leader with a tidy org chart genuinely believes she understands her business, and in a narrow sense she does. What she rarely realises is how much of that understanding is structural rather than behavioural, a picture of what the business is arranged to look like on paper rather than what it actually does once real work starts moving through it. The gap between those two pictures is exactly where the technology client’s three week delays had been hiding, invisible to a chart that was never designed to notice them in the first place.
I have started asking a specific pair of questions whenever a client brings me an org chart, a process map or any other diagram built primarily from things. First, which two boxes on this page depend on each other the most in practice, regardless of how far apart they sit visually. Second, does anyone currently track how well that particular relationship is functioning, or does its health only ever get discussed after something has already gone wrong. In the technology client’s case, the honest answer to the second question was that the relationship between two specific teams, engineering and customer support, had never once been the subject of its own conversation, despite being, by her own later admission, the single connection most responsible for how quickly a request actually reached a customer.

“You can draw every box perfectly and still miss the one relationship actually running the show.”
A colleague of mine, a fellow visual thinking consultant who works often with family businesses, once described a company where the two founding siblings each ran a clearly defined half of the business, each half performing well by every measure either sibling tracked individually. The company’s overall growth had nonetheless stalled for three years running. It was only when someone finally mapped the relationship between the siblings themselves, rather than the two halves of the business they each ran, that the real pattern surfaced. A disagreement from years earlier had quietly hardened into an unspoken rule that neither half would ever refer a client to the other, even when doing so would obviously have served the client better, because the relationship itself had never been repaired or even properly named as the thing actually limiting growth.
What changes once you draw the relationship
Drawing a relationship rather than a thing forces a different kind of honesty, because a relationship cannot be described accurately without naming direction, frequency and dependency, three qualities a simple box never has to account for. Does information flow both ways between these two teams, or mostly one way. How often does that flow actually happen, daily, weekly, only during a crisis. How much does one side depend on the other, and is that dependency mutual or does it run mostly in a single direction.
Get Ai Yat Goh’s stories in your inbox
Join Medium for free to get updates from this writer.
Answering those three questions honestly about the relationship between engineering and customer support revealed exactly what the org chart had hidden. Information flowed almost entirely in one direction, from engineering to support, and only when engineering happened to remember to share it, which in practice meant roughly half the time. Support depended heavily on engineering for accurate answers. Engineering depended on support for almost nothing in return, which meant the relationship carried no natural pressure to stay current, because the side with less at stake in keeping it healthy was also the side controlling how often it actually happened.

“A relationship has a direction, a frequency and a dependency. A box on an org chart has none of these.”
Once that imbalance was visible, the fix did not require restructuring either team. It required a weekly ten minute sync, deliberately scheduled rather than left to memory, with a single standing question, what has changed this week that support needs to know before a customer asks about it. The relationship itself became the thing being managed, rather than an invisible byproduct of two teams each managing only their own box.
What I find most useful about this particular fix is how little it resembles the kind of solution most organisations reach for first. Nobody proposed a new tool, a new reporting structure or a new role dedicated to coordination. The relationship needed attention, not architecture, and attention is almost always cheaper and faster to supply than architecture is, provided someone has first noticed that attention is the actual gap. Many of the heavier fixes I see proposed in workshops, entire new departments built to manage coordination between two existing ones, are really an attempt to solve a relationship problem using the only tool a thing focused mind knows how to reach for, which is to create another thing.
Carrying this into the rest of the circle
This shift, from things to relationships, is close to the heart of what systems thinking actually asks of a person, and it connects directly to everything this circle has covered so far. The boundary decides who is in the room. The edge is where two systems meet. This post asks you to look specifically at what happens inside that meeting, the direction, frequency and dependency running through it, rather than assuming a well drawn map of things has already told you everything worth knowing.
The next post in this circle asks a single, sharpened question that pulls all of this together, a way of testing quickly whether you are actually looking at a system or still looking at a list dressed up to resemble one. That question depends entirely on the habit this post is asking you to build now, the habit of reaching past the comfortable clarity of a well labelled box and asking instead what is actually moving, in which direction, and how often, between it and everything else it touches.
The technology client eventually redrew her org chart, though redrew is not quite the right word for what she actually did. She kept the original chart largely as it was, since the boxes themselves had never been the problem, and added a second layer on top of it, arrows showing the handful of relationships that mattered most in practice, each labelled with how often it should happen and who was responsible for keeping it alive. The second layer, she told me later, taught her more about her own business in one afternoon than the original chart had taught her in the three years she had been using it.
She kept both layers pinned to the wall of her office afterwards, side by side rather than merged into one, and she told me she found herself glancing at the second layer far more often than the first. The chart of things had always been reassuring to look at, tidy and complete in the way a finished document feels complete. The chart of relationships was messier, a handful of arrows with notes in the margins, revised every few months as old dependencies faded and new ones took their place. It was also, by her own account, the only one of the two that had ever actually helped her fix anything.
A note on the book that shapes this series
This post stays inside the Story stage of the S.T.A.R. System, where Sherrie Low and I encourage people to look past the things a situation contains and towards the relationships actually running between them. In The S.T.A.R. System: Applying Visual Thinking for Career & Business Success, we treat this shift, from naming things to naming relationships, as one of the clearest markers that Story work has moved from a surface description towards something a picture can actually explain.
A relationship has a direction, a frequency and a dependency, three qualities no single box on an org chart is ever built to carry. Naming those three qualities honestly for the handful of relationships that matter most, rather than assuming a tidy map of things has already told the whole story, is often the single move that turns a confusing pattern of delays or misunderstandings into something a team can finally see, name and manage together.
Which relationship in your own system has never once been drawn, named or scheduled on its own terms?
Next in this series, we look at the question that reveals whether you are looking at a system or a list.
If this way of seeing resonates with you, The S.T.A.R. System: Applying Visual Thinking for Career & Business Success, co authored with Sherrie Low, walks through the full method behind it. Find it on Amazon.

Ai Yat Goh is a Visual Thinking Strategist, educator and entrepreneur, and Asia’s first Master Trainer for Dan Roam’s Power of Visual Series. Connect on LinkedIn or follow the full series on Medium.
#FromNoiseToClarity #SystemsThinking #VisualThinking #TeamCollaboration #OrganisationalDesign
BK HAN Candy Chan RH Malini Joelynn Kohjoe Lawrence Lee GOW Hui Yian