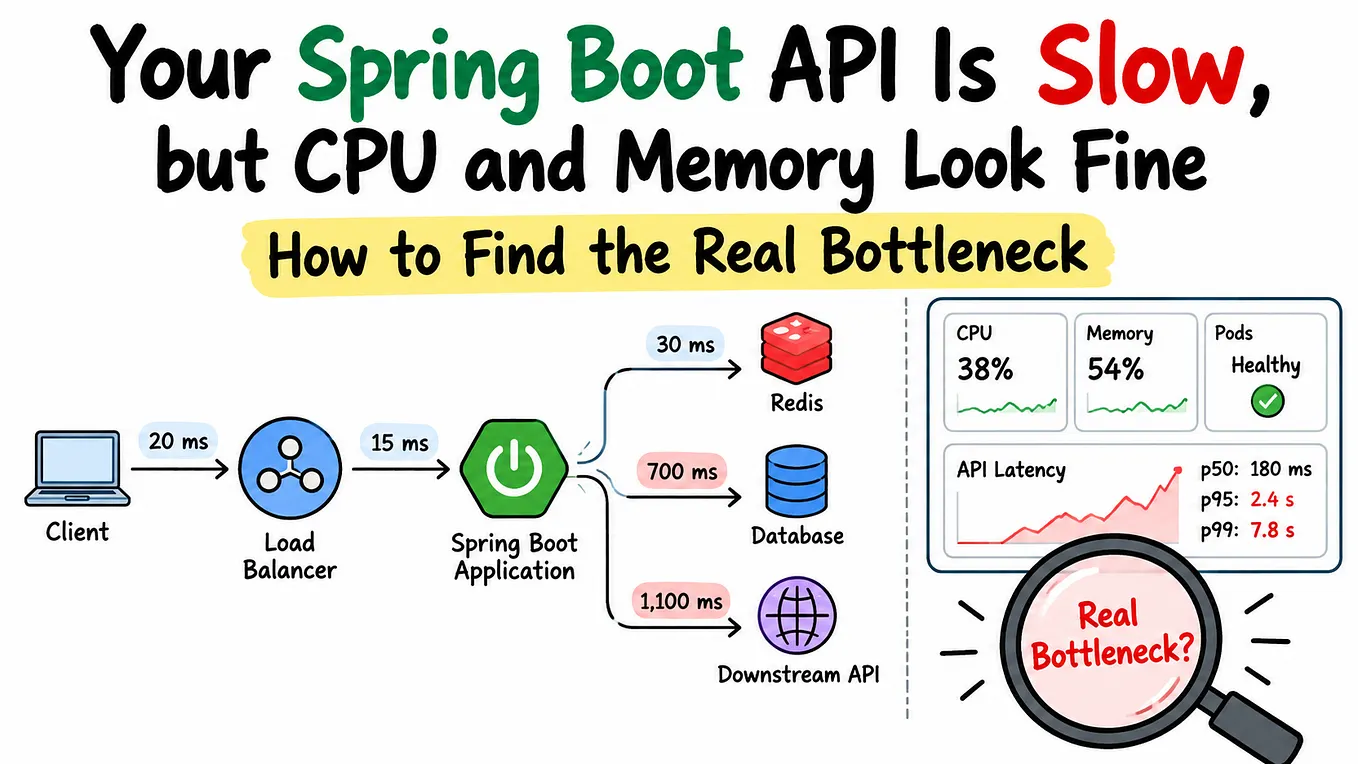
Analyzing a Java thread dump is essential for identifying performance bottlenecks, deadlocks, and other issues in a Java application. A thread dump provides a snapshot of all threads in a Java Virtual Machine (JVM) at a given point in time, showing what each thread is doing and whether it’s blocked, waiting, or running.

Here’s a guide on how to analyze a Java thread dump:
1. Obtain the Thread Dump
There are several ways to generate a thread dump:
From a Java process (via command):
- Linux/Unix/Mac:
kill -3 <pid>(replace<pid>with the process ID).
Using JVisualVM: JVisualVM is a graphical tool that comes with the JDK and allows you to inspect thread dumps.
Using jstack: If you have the PID of the Java process, use jstack <pid> from the command line.
Using JMX or other monitoring tools: Tools like Prometheus, AppDynamics, or New Relic may also capture thread dumps.
2. Understanding the Structure of a Thread Dump
A typical thread dump contains:
Thread Name: Identifies the thread, such as main, http-nio-8080-exec-3, etc.
Thread State: Indicates the current state of the thread. Common states are:
RUNNABLE: The thread is executing or waiting for CPU.WAITING: The thread is waiting for some condition (e.g., on aObject.wait()call).BLOCKED: The thread is blocked waiting for a lock.TIMED_WAITING: The thread is waiting for a specific period of time (e.g.,Thread.sleep()).NEW,TERMINATED: Less common, but indicate the thread’s lifecycle status.
Stack Trace: Shows the current method calls for the thread, from the top-level method to the method where the thread is currently paused or running.
Each thread’s state and stack trace will be printed, typically in the following format:
"main" #1 prio=5 os_prio=0 tid=0x00007fb8f08a0800 nid=0x3e5 waiting on condition [0x00007fb8f37f0000]
   java.lang.Thread.State: WAITING (parking)
        at sun.misc.Unsafe.park(Native Method)
        at java.util.concurrent.locks.LockSupport.park(LockSupport.java:175)
        at java.util.concurrent.locks.AbstractQueuedSynchronizer$ConditionObject.await(AbstractQueuedSynchronizer.java:2043)
        at java.util.concurrent.LinkedBlockingQueue.take(LinkedBlockingQueue.java:442)
        at java.util.concurrent.ThreadPoolExecutor.getTask(ThreadPoolExecutor.java:1067)
        at java.util.concurrent.ThreadPoolExecutor.runWorker(ThreadPoolExecutor.java:1133)
        at java.util.concurrent.ThreadPoolExecutor$Worker.run(ThreadPoolExecutor.java:603)
        at java.lang.Thread.run(Thread.java:722)
3. Common Issues to Look For
Deadlocks: A deadlock occurs when two or more threads are blocked forever, waiting for each other to release locks.
- Detecting Deadlocks: Look for a section in the thread dump that looks like this:
Found one Java-level deadlock:
==============================
"Thread-1" waiting to lock monitor 0x00007f8c08001b68 (object 0x00007f8c0c000020, a java.lang.Object),
    which is held by "Thread-2"
"Thread-2" waiting to lock monitor 0x00007f8c08001b68 (object 0x00007f8c0c000020, a java.lang.Object),
which is held by "Thread-1"- This indicates that
Thread-1andThread-2are waiting for each other’s resources, causing a deadlock.
Blocked Threads: A thread may be in the BLOCKED state if it is waiting to acquire a lock held by another thread.
- What to look for: Threads that are blocked waiting for a specific monitor lock.
- Example:
"Thread-1" #1 prio=5 os_prio=0 tid=0x00007f8c2b490800 nid=0x9c9 waiting for monitor entry [0x00007f8c4c3d1000]
    java.lang.Thread.State: BLOCKED (on object monitor)
    at com.example.MyClass.myMethod(MyClass.java:25)
    - waiting to lock <0x0000000002f5c0d0> (a java.lang.Object)
    at com.example.MyClass.myOtherMethod(MyClass.java:35)
High CPU Utilization: Look for threads in the RUNNABLE state, which are actively consuming CPU resources. These might indicate performance bottlenecks or infinite loops.
- Check if a particular thread is consuming most of the CPU time.
- Example:
"Thread-3" #2 prio=5 os_prio=0 tid=0x00007f8c2b491c00 nid=0x9d0 runnable [0x00007f8c4c3d3000]
    java.lang.Thread.State: RUNNABLE
    at com.example.MyClass.doHeavyComputation(MyClass.java:98)
Long-running Threads: Identify threads that have been running for an unusually long time. These can sometimes be an indication of inefficient algorithms or resource contention.
Get Anilabha Baral’s stories in your inbox
Join Medium for free to get updates from this writer.
Thread Pool Exhaustion: If all threads in the pool are busy, it could cause performance degradation and delays. Threads may be waiting for a task from the queue or resources.
- Example:
"pool-1-thread-1" #12 prio=5 os_prio=0 tid=0x00007f8c3d4d2000 nid=0x2003 waiting on condition [0x00007f8c4c3d2000]
    java.lang.Thread.State: WAITING (waiting for task)
    at java.util.concurrent.LinkedBlockingQueue.take(LinkedBlockingQueue.java:442)
    at java.util.concurrent.ThreadPoolExecutor.getTask(ThreadPoolExecutor.java:1067)
4. Steps for Analysis
Step 1: Identify the thread states:
- Check for any threads in the
BLOCKED,WAITING, orTIMED_WAITINGstates. - Identify if there are any threads in
RUNNABLEconsuming excessive CPU.
Step 2: Look for deadlocks:
- Check for the deadlock section in the thread dump.
Step 3: Investigate long-running threads:
- Identify threads that have been running for an extended period (without returning).
Step 4: Check thread pool usage:
- Look for threads in
WAITINGorTIMED_WAITINGin a thread pool scenario.
Step 5: Review stack traces:
- Analyze the stack traces for common patterns, such as repetitive method calls or excessive recursion.
Step 6: Look for JVM issues:
- Occasionally, the JVM itself may show issues (e.g., stuck garbage collection). Look for GC-related threads or memory issues in the dump.
5. Tools for Analysis
Thread Dump Analyzers: There are several tools that can help visualize and analyze thread dumps:
- Thread Dump Analyzer (TDA): A free tool that allows you to upload and analyze thread dumps.
- FastThread: An online thread dump analysis tool that can provide insights into deadlocks, bottlenecks, and thread states.
- JProfiler, VisualVM, or YourKit: These are Java profilers that can also analyze thread dumps and provide a graphical view.
- TDA — Thread Dump Analyzer(by irockel): The TDA Thread Dump Analyzer for Java is a small Swing GUI for analyzing Thread Dumps and Heap Information generated by the Java VM. It parses the thread dumps and class histograms from a provided log file.
6. Follow-up Actions
After analyzing the thread dump, take action based on what you find:
- If there are deadlocks, resolve the issue by refactoring the locking strategy or using
java.util.concurrentconstructs. - If there are blocked threads, identify the resources they are waiting for and improve synchronization or reduce contention.
- If there are high CPU issues, optimize the algorithm or offload heavy operations to separate threads or processes.
- If the thread pool is exhausted, increase the thread pool size or investigate why the tasks are taking so long to execute.
By following this approach, you should be able to identify and resolve common issues within a Java application.