Stop Guessing About Your Image Dataset: A Practical EDA Guide with Pandas and Matplotlib


A tutorial on how to use pandas and matplotlib for data analysis.
Introduction
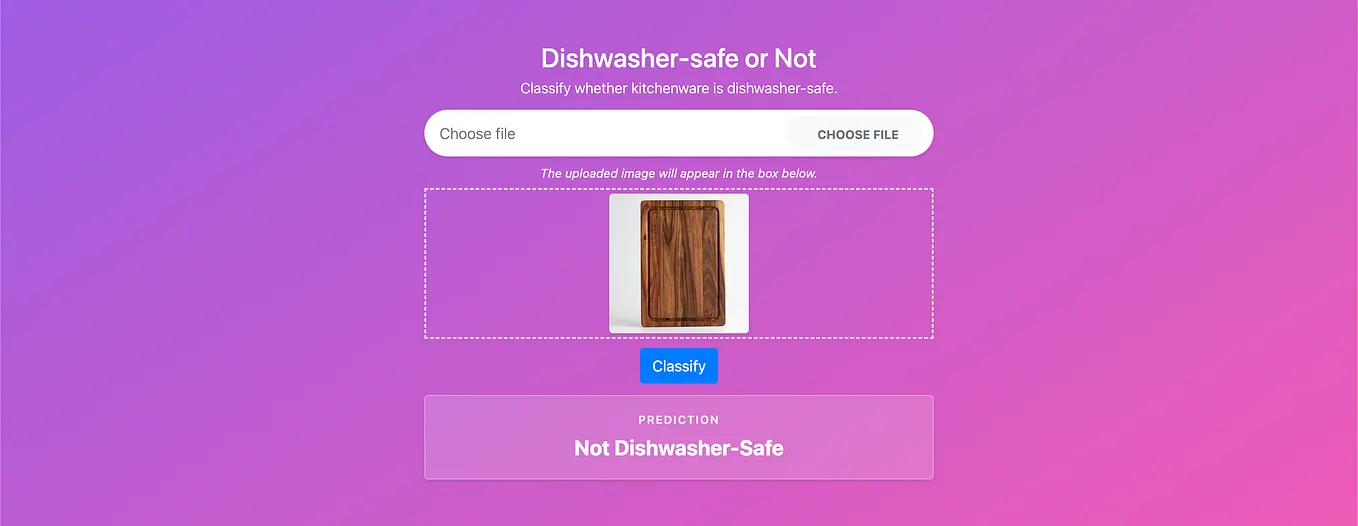
When I built the dishwasher-safe-or-not dataset from scratch, I assumed the hard part was collecting the images. It wasn’t. The hard part was figuring out what I actually had once the images were collected, such as how many classes, how many examples per class, and whether the distribution was balanced enough to train on without the model learning the wrong things.
Before touching a single model, I spent time doing exploratory data analysis on the image dataset using just Pandas and Matplotlib. What I found changed how I approached the entire project: the dataset was significantly imbalanced across both classes and sub-classes, and catching that early saved me from training a model with a built-in bias toward the majority class.
Get Anushree Das’s stories in your inbox
Join Medium for free to get updates from this writer.
This article walks through exactly how I did it — no deep learning required, just the tools you’re probably already using.
Dataset
For this analysis, we’ll utilize a dataset available on Kaggle: https://www.kaggle.com/datasets/anushreesitaramdas/dishwasher-safe-or-not. Let’s kick off our exploration by gaining a thorough understanding of the dataset’s directory structure.

The dataset is categorized into two primary classes: dishwasher-safe kitchenware and not dishwasher-safe kitchenware. These main classes are further subdivided into sub-classes, each representing different types of kitchenware such as spoons, plates, mugs, and more.
Let’s start coding..
Before we start analyzing the dataset, we need to import some libraries and load the dataset.
import os
import pandas as pd
import pickle
import matplotlib.pyplot as plt
positive_images_path = '../final_data/dishwasher-safe'
negative_images_path = '../final_data/not-dishwasher-safe'
ext = ['JPG', 'jpeg', 'png', 'jpg', 'gif', 'webp']
# Create a pandas dataframe
df = pd.DataFrame(columns = ['Filename','Class','Sub_Class'])
def load_data(df, images_path, y):
# get all sub-classes (sub-directories)
subdirs = [s for s in os.listdir(images_path) if os.path.isdir(os.path.join(images_path,s))]
for subdir in subdirs:
path = os.path.join(images_path,subdir)
with os.scandir(path) as files:
for filename in files:
f = os.path.join(path, filename)
# checking if it is an image file
if os.path.isfile(f) and f.split('.')[-1] in ext:
df.loc[len(df.index)] = [filename.name, y, subdir]
load_data(df, positive_images_path,'dishwasher-safe')
load_data(df, negative_images_path, 'not-dishwasher-safe')
print(df.head())
print(df.info())The load_data() iterates over all the sub-directories in the given path and stores the image filename, image class and sub-class in a pandas dataframe. The pandas in-built methods df.head() and df.info() gives the following output:

To save the dataframe, use the following code:
df.to_csv('../data.csv', sep=',')Data Visualization
Now, we can extract and visualize the class distributions using matplotlib. To get the class distribution, we will use the value_counts() provided by pandas.
# Get number of images belonging to each class
class_counts = df['Class'].value_counts()

# Create a bar chart
plt.figure(figsize=(8, 6))
class_counts.plot(kind='bar', color='skyblue')
plt.title('Counts of Classes')
plt.xlabel('Class')
plt.ylabel('Count')

# Display the chart
plt.tight_layout()

# Save the graph
plt.savefig("../class_dist.png")

plt.show()
When we print the variable class_counts, it looks something like this:
Class
dishwasher-safe        716
not-dishwasher-safe    521
Name: count, dtype: int64
Similarly, we can plot the distribution for sub-classes.
# Get number of images belonging to each sub-class
sub_class_counts = df['Sub_Class'].value_counts()

# Create a bar chart
plt.figure(figsize=(8, 6))
sub_class_counts.plot(kind='bar', color='skyblue')
plt.title('Counts of Sub-Classes')
plt.xlabel('Sub-Class')
plt.ylabel('Count')

# Display the chart
plt.tight_layout()

plt.savefig("../sub_class_dist.png")

plt.show()
Another important piece of information we can gather from the dataframe is the number of sub-classes.
len(sub_class_counts)
>>> 55
Observations
Looking at the class distribution, the dataset contains 716 dishwasher-safe images and 521 not-dishwasher-safe images — roughly a 58/42 split. That’s moderate imbalance at the top level, but the sub-class distribution tells a more concerning story.
With 55 sub-classes spread across 1,237 total images, some categories have a handful of examples while others have well over 100. This kind of long-tail distribution is common when you collect image data from the web without strict quotas per category, and it creates a real risk: a model trained on this as-is will learn to recognize spoons extremely well and struggle badly with underrepresented kitchenware types.
A few things this analysis made clear before any training began:
- Certain sub-classes don’t have enough samples to train on reliably and may need to be merged or dropped
- Augmentation alone won’t fix a sub-class with five images — more data collection is needed in specific gaps
- Evaluation metrics like accuracy will be misleading on this dataset; precision, recall, and F1 per class will tell a more honest story
The next step was to go deeper — rather than just counting images per category, I wanted to check whether the images within each cluster were actually visually coherent, or whether the labels were doing more work than the visual content. That’s what the follow-up article covers, using VGG16 features and KMeans clustering to find structure without relying on labels at all.