Climate Despair Is an Accounting Error

By Ali Bin Shahid
Member of the EcoRestoration Alliance

This might be a dense piece, so to make it digestible, I have highlighted the denser words and defined them in call-out boxes below the paragraph, it might break the flow, but if you are familiar with the jargon, you can skip the callouts, without losing anything.
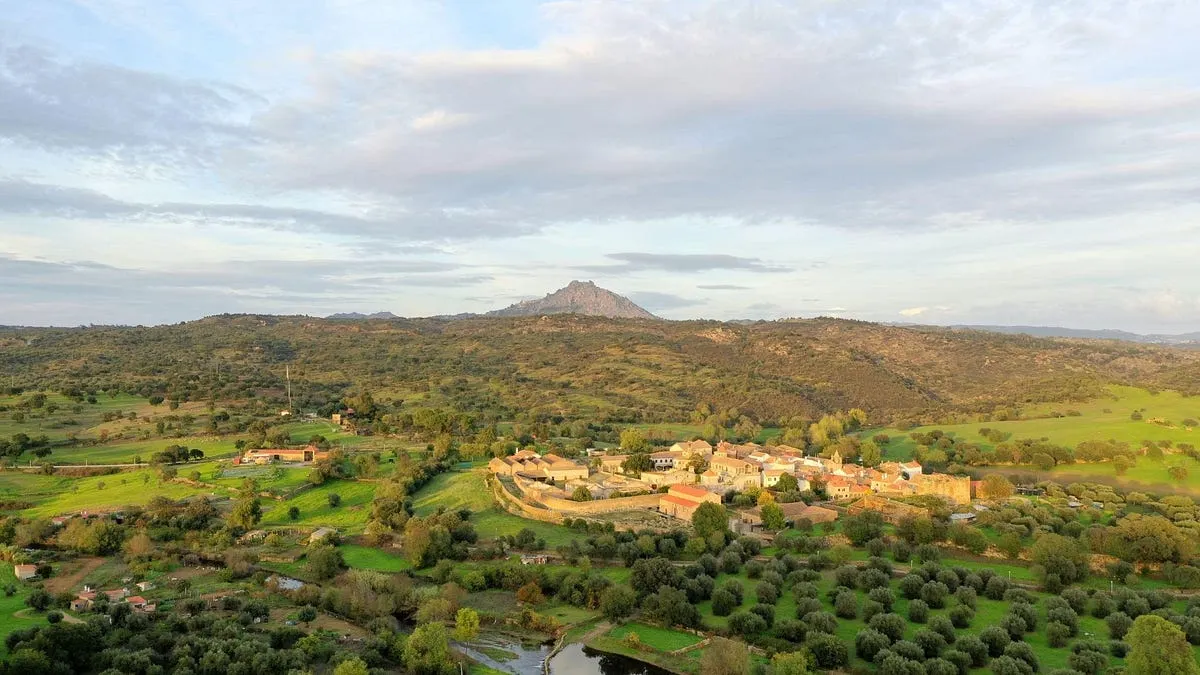
There is a river basin in southeastern Spain, the Vinalopó, where the springs have gone silent and the water table has fallen by roughly 179 metres . If you reached for the obvious explanation you would say drought, and then you would say climate change, and you would be wrong. The rainfall over that basin has not meaningfully changed in eighty years. The long trend is flat, statistically indistinguishable from zero . For a changing climate to have emptied the Vinalopó through less rain, precipitation would have had to fall by something close to 300 millimetres a year , which is about twenty-five times the observed change and in the wrong direction. The basin did not run out of water falling from the sky. It ran out of the machinery that turned sky-water into groundwater, because that machinery was pumped, drained, and re-plumbed across a century until it could no longer recharge itself.
I start here because the Vinalopó is the cleanest example I know of a whole category of cause that our best attribution science is built, by design, to miss.
A colleague, Tom Harris, recently published a clear and generous explainer on extreme-weather attribution and I absolutely loved it, the science that assigns a climate-change contribution to a specific heatwave or flood. However, I have a few points to add. So, before I do, a disclaimer, I am not writing to dispute it in the way these exchanges usually go. The warming is real. It shows up at every scale, from the global mean down to the July record at a single English weather station, and Tom’s walk through the method is honest and well-chosen. His opening example, comparing the temperature distribution of southern England against the Scottish Highlands and then against the same English station fifty years ago, is right, and it is right for a reason worth holding onto: a heatwave really is a shifted distribution. When you attribute one, you are measuring how far the whole bell curve has slid, and for heat that method is on solid ground. The World Weather Attribution studies he cites are careful, peer-reviewed, and mostly correct about the thing they measure.
What is extreme-weather attribution?Extreme-weather attribution is the science of taking one particular flood or heatwave and working out how much of it climate change is responsible for. It is an actual field with methods, and it publishes numbers like “this rainfall was made twenty percent more likely by warming.” What follows is about what that method can and cannot see. It is not about whether warming is real.
The trouble is what they measure, and it becomes visible only when you read the flood and storm examples next to the heat examples.
Every one of those examples attributes the climate signal through a single channel, the thermodynamic one. Warmer air holds more water vapour, so the rain is heavier. A warmer sea evaporates faster, so the storm has more fuel. The most revealing case is the storyline method Tom describes for the 1903 windstorm, where the historical event is replayed in a warmer world. Look at how that replay is constructed. The atmospheric circulation is held fixed, deliberately constrained to be almost identical to the original, and only the sea-surface temperature, the humidity, and the near-surface air temperature are raised. That is not an oversight. It is the defining move of the method, and it is a defensible one, because the way warming will change the large-scale circulation is genuinely uncertain, and the honest response to an uncertainty you cannot constrain is to freeze it and vary only the part you can. Ted Shepherd, who named the approach, was explicit that this makes it a conditional answer ( Shepherd et al. 2018).
What is the storyline Method? Take a real historical storm. Rebuild it inside a computer, but turn the sea temperature and the humidity up to today’s values, and force the winds to follow almost exactly the track they originally took. Then compare the two. The difference tells you how much worse that same storm would be in a warmer world. Holding the winds fixed is an honest choice, because nobody can reliably predict how warming changes wind patterns, so the method freezes what it cannot constrain. But that is also its limit. It can tell you how much a warmer atmosphere amplified a storm that already existed. It cannot tell you why the storm was there.
But conditional on what, and at what cost. A method that freezes the circulation can tell you how much more moisture a warmer atmosphere loaded into a given weather pattern. It cannot tell you what produced the pattern. And for a large class of the disasters we care most about, the pattern is the whole story.
So I took one of the flagship cases, the 2022 Pakistan floods, and did the decomposition myself in the reanalysis. The quantity that matters for a flood is the convergence of moisture over the affected region, the rate at which the atmosphere is funnelling water into the same place. You can split the anomaly in that convergence into two parts. One part is dynamic, the anomalous winds acting on ordinary humidity, which is to say the circulation doing the work. The other is thermodynamic, ordinary winds acting on anomalously moist air, which is to say the warming signal the attribution method is built to see. Over the Sindh flood region, across both the full month and the peak flood window, the convergence came out between 96 and 111 percent dynamic. The thermodynamic term was essentially zero, and in some framings slightly negative . The Arabian Sea was warm, but only about three tenths of a degree above its own recent average, a modest marine heatwave, not a great thermal reservoir. The stalled circulation did nearly all of the work, and the reflexive chain of warm ocean to moister air to bigger flood was the smallest term in the budget.
is a reconstruction of the atmosphere’s hour-by-hour history. Every observation we have, from weather balloons to ships to satellites, is fed into a physics model that works out what the whole sky must have been doing at every moment, everywhere, back to 1940. It is the closest thing that exists to a recording of the past atmosphere.
What is moisture convergence? Rain does not come from the air directly above you. It comes from air arriving. Over any patch of ground, wind is constantly carrying water vapour in through one side and out through the other. When more arrives than leaves, the surplus has nowhere to go but down. That surplus is moisture convergence, and it is the quantity that actually makes a flood. It is not how wet the sky is. It is how hard the sky is funnelling water into one place and leaving it there.
Splitting the anomaly into two parts! The water arriving over a place is only two things multiplied together: how the wind is blowing, and how wet the air is. Think of deliveries. Cargo piles up either because more trucks turned up, or because each truck was fuller. You can separate the two. Pair the real winds of that month with an ordinary month’s humidity, and you have measured what the trucks did. Pair an ordinary month’s winds with the real humidity, and you have measured what the fullness did. Add those, plus a small term for both being unusual at once, and you get the whole thing back exactly. It is arithmetic. Nothing is assumed and nothing is modelled.
How are the percentages more than 100%? How can a part be more than the whole? Because the parts add to the whole but do not all have to be positive. Here the wind term came out at about 111, the moisture term at about minus 17, and the small both-at-once term at about 6. Those sum to 100, which is the whole flood. A negative moisture term means the extra humidity, in the pattern it actually took, very slightly worked against the convergence instead of helping it. So the winds had to account for more than the whole event, because part of what they delivered got cancelled. It is a bank balance: earn 111, lose 17, find 6, and you are up 100. Your earnings are 111 percent of the change.
That settles which channel did the work. It does not settle what drove the channel, so I went looking for that too. Across every August from 1940 to 2024, 2022 turns out to be the strongest circulation-driven convergence over Sindh in the entire record, two and a half standard deviations clear of the mean.
I regressed those eighty-five years on the drivers that attribution reaches for first: the ENSO state, the strength of its atmospheric coupling, and the warmth of the Arabian Sea
Two and half standard deviations! A standard deviation is the ordinary amount a thing wobbles around its own average. One is a normal year. Two is unusual. Two and a half, in a record of eighty-five years, means you are looking at the most extreme entry in it. 2022 was not merely a big year for wind-driven moisture convergence over Sindh. It was the biggest there has been.
A regression is the arithmetic for one question: if I had known the driver, how much of the outcome could I have predicted? You line up eighty-five years of both and measure how much of the wiggle in one is matched by wiggle in the other. The answer comes back as a share. A driver that explained everything would let you predict every year exactly. A driver that explained nothing leaves you no better off than guessing. So “El Niño explains about an eighth” means that knowing the state of the Pacific gets you roughly an eighth of the way to predicting how hard the winds converged moisture over Sindh that August.
The Arabian Sea does not reach significance at all, in any August of the record, which is worth sitting with given how readily a warm sea is offered as the explanation for a flood. El Niño does better, and is real and statistically significant, but it accounts for about an eighth of the variance, which makes it a contributor and not an explanation.
Get EcoRestoration Alliance’s stories in your inbox
Join Medium for free to get updates from this writer.
Line up two completely unrelated things and they will still show some accidental resemblance, purely by luck. Significance is the test for whether what you are seeing is bigger than that luck. Saying the Arabian Sea “does not reach significance” means its relationship with Pakistan’s winds is no stronger than what two unrelated records would produce by accident. This is not a weak signal. It is not distinguishable from no signal at all.
Together the three of them account for seventeen percent of what happened in 2022. So whatever produced the strongest such August in eighty-five years, it was not warmer air, it was not the warm sea, and it was not carrying the load that gets hung on it.
What is El-Nino? Every few years the Pacific trade winds slacken, and the vast pool of warm water they normally hold piled against Indonesia sloshes back east. The eastern Pacific goes warm, the west goes cool. Because the tropical Pacific is where the atmosphere’s biggest thunderstorm engines sit, moving those engines shifts winds over half the planet. La Niña is the same machine running backwards. One thing gets constantly lost in the coverage: El Niño does not add heat to the Earth. It moves heat that was already in the ocean up into the air, which is why the global average rises during an El Niño and settles back afterwards. It is a redistribution, not a source.
The five sixths they leave standing is unexplained, by an amount that is exactly what you would expect the largest residual in a record this long to be by chance alone.
When something is left unexplained, the temptation is to assume a hidden cause. But roll dice eighty-five times and the highest roll will look startling. That is simply what “highest of eighty-five” means. You can calculate how extreme the biggest fluke in a record of a given length ought to be, and the unexplained part of 2022 sits almost exactly on that expectation. So the leftover is not evidence of something hidden. It is the size ordinary chance produces. That is a boring answer and it is the honest one.
This is not a fringe result, and it is not mine alone. The regional attribution literature attributes the 2022 event to a mid-tropospheric cap failure and a large-scale circulation anomaly, and my own earlier work on Pakistan’s orographic structure reached the same conclusion from a different direction, that the flood dynamics were circulation-driven rather than a simple consequence of a moister sky. For at least this one flagship climate flood, the channel the attribution method is designed to measure was not the channel that caused the disaster.
None of which makes the land surface a bystander in Pakistan. It governs something else, and arguably something more consequential: not how much water arrives, but what the water does when it gets there. Vegetation sets the height at which rising air condenses, and that single lever decides whether the monsoon lands as distributed orographic rain that soaks in and recharges an aquifer, or as concentrated cloudbursts that kill people and run straight off the hillside ( Shahid 2026, the atmospheric valve). The circulation brought the water. The state of the land decided what the water did with itself. Only one of those two is in anybody’s ledger, and it is not the one we can change.
One event does not overturn a science. The deeper problem is the ledger the whole method stands on.
What is effective radiative forcing?
Climate policy runs on a balance sheet. Everything humans do that tips Earth’s energy budget gets an entry on it, and each entry is called an effective radiative forcing. The unit is watts per square metre, which is simply how much extra heat every square metre of the planet holds on to because of that thing. Carbon dioxide’s entry is 2.16, held with high confidence. For scale, a square metre of the tropics receives a few hundred watts of sunlight, so 2.16 sounds small, and it is enormous once applied to every square metre of the planet for a century. That framework was built for gases that mix evenly through the whole atmosphere, which is exactly why it works so well for carbon dioxide. A molecule over Lahore does the same job as a molecule over Lima, so a single number describes the planet. But the living surface tips the very same budget by an entirely different route. It moves water. Forests evaporate, that evaporation builds cloud, and cloud changes what the planet reflects and what it radiates away. That is the water cycle doing radiative work. It is patchy, regional, and tied to particular ground, and it does not fit the shape of a ledger designed for gases. So it has no entry. The IPCC’s own report on land assigns it no confidence in its global size, or even in its direction. Not a small number. No number at all. What is the excluded term? Call that missing entry the effective biosphere forcing, and here is its size. Satellites put forest about 11 watts per square metre apart from cleared land at the same latitude. Track forest loss through time and the number moves with the chainsaw at about a tenth of a watt for every one percent of forest cleared, at nearly the same rate in the Amazon, the Congo and Southeast Asia independently. Apply that rate to the roughly 17 percent of the Amazon already cleared, and you get a forcing of 1.7 to 2.4 watts per square metre. Carbon dioxide’s entry, for the entire planet, is 2.16. Those two numbers are not the same kind of thing, and it matters to say so. One is regional and one is global, and the mechanisms are physically different, so they cannot simply be added together. But they are the same size, in the same units, measured at the same surface. Only one of them is on the books.
Climate attribution inherits its accounting from the effective radiative forcingframework, which prices human influence on the planet’s energy balance in watts per square metre. Carbon dioxide gets 2.16 watts per square metre , assigned with high confidence, and that number is not in question. The spectroscopy is settled. But the same framework, in the IPCC’s own land report, assigns the biophysical effects of changing the land surface, the evapotranspiration, the cloud formation, the moisture recycling, no confidence in their global magnitude or even their sign. Not a small number. No number at all. The framework was designed for well-mixed gases, and a heterogeneous, hydrological, non-radiative forcing does not fit its shape, so it is left out.
That excluded term is not small. Comparing satellite radiation from CERES against land cover from MODIS in my own analysis, and holding latitude fixed so the carbon dioxide overhead is identical, forest cells sit about 11 watts per square metre lower in outgoing longwave radiation than the non-forest land beside them. That is a top-of-atmosphere difference, the same quantity and the same measurement surface as the carbon dioxide forcing, and it is being produced by the living surface alone. This is not a lone finding. A decade of independent satellite work has found that forests cool the surface they occupy across the tropics and mid-latitudes ( Alkama and Cescatti 2016; Duveiller et al. 2021), with the effect reversing only at high latitudes, where the dark canopy of evergreen forest over snow lowers the albedo ( Lee et al. 2011). Track the change through time with high-resolution forest-loss data and the causal signature holds up across three separate continents: deforestation raises outgoing longwave radiation at a convergent rate of about a tenth of a watt per square metre for every one percent of forest lost , in the Amazon, the Congo, and Southeast Asia independently. Scale that to the deforestation the Amazon has already suffered and you get a regional perturbation on the order of the entire global carbon dioxide forcing, a magnitude in line with earlier estimates that clearing the tropics entirely could warm the planet comparably to every tonne of fossil carbon burned to date ( Lawrence and Vandecar 2015). It is the same size as the term we track with high confidence, and it is nowhere in the ledger.
Water regulation is the second face of the same excluded vector, and the Vinalopó is only its cleanest instance. It is not a regional oddity either. Across the Iberian Mediterranean, the karst systems that actually store and move this water turn out to be systematically larger than their official designations, hiding on the order of two cubic kilometres a year of unmonitored groundwater discharge ( Shahid 2026, Iberian karst). The water accounting was already wrong before anyone thought to ask the climate question. Dams, diversions, lined channels, and deep-well extraction geometrically reorganise how water moves through a basin, and in doing so they strip the buffers, the stored soil moisture, the wetlands, the recycled evapotranspiration, that used to turn an external shock into a recoverable wobble ( Seneviratne et al. 2010 on the soil-moisture buffer, Makarieva and Gorshkov 2007 on the forest-driven pump that carries ocean moisture inland).
Strip those buffers and the same shock, the same El Niño, the same dry year, the same slow warming, now lands as drought, fire, and aquifer collapse. That is not a figure of speech. In the Amazon I have watched El Niño deliver more moisture along the low-level jet and yet leave less rain on the ground, because the quantity that decides the outcome is not what the sky brings but what the surface is still able to receive ( Shahid 2026, ENSO and the Amazonian low-level jet). The same forcing, met by a different surface, produces a different disaster.
The effect is not confined to arid basins either. Forty-three subarctic dams above 50 degrees north have quietly shifted about 407 cubic kilometres of river discharge a year out of the natural summer freshet and into a forced winter release, delivering a freshwater forcing of roughly 0.013 sverdrups onto exactly the North Atlantic convection sites that drive the overturning circulation ( Shahid and Yates 2026). That is the same order of magnitude as the meltwater coming off Greenland, and the dams got there about thirty years earlier. It carries a measurable salinity fingerprint at Hudson Strait, and it is invisible to the climate models the attribution studies rely on, because their runoff schemes carry only the annual mean and never see the seasonal reshaping.
Now let me be careful about what I am not claiming, because this is exactly the discipline the doom pieces abandon and the reason they should not be trusted. I am not claiming a measured global total for this excluded vector that rivals carbon dioxide. Adding these regional forcings into a single planetary number, combining a radiative term in watts, a haline term in sverdrups, and a hydrological cascade that does not reduce to either, is genuinely hard, and I have not done it, and neither has anyone else. That aggregate is asserted, not proven, and I will say so as plainly as I can. What is proven, and measured, and replicated, is narrower and still decisive: the vector exists, it is real at regional scale, it is the same order of magnitude as the forcing the ledger does track, and it is excluded from that ledger and from the attribution machinery built on top of it. Every claim that a flood was made twenty percent more likely by climate change is a true statement about one channel, computed on a ledger that omits a channel of comparable size.
And here is the part that matters most, the reason I find none of this cause for the despair the genre trades in.
The excluded term is the modifiable one. You cannot un-emit yesterday’s carbon dioxide. The molecules are in the air for centuries, and no policy reaches back to remove them. But a buffer can be rebuilt, and when it is rebuilt the recovery is measurable and fast. On China’s Loess Plateau, the largest deliberate revegetation programme in human history put water back into the root zone at a rate you can detect with a matched-pair design against unrestored controls. The Vinalopó, the same basin whose collapse opened this piece, has already rebounded about 30 metres at the water table in the few years since extraction eased. The cascade takes generations to build and years to reverse. That asymmetry is the whole argument. A frame that reads every disaster as a referendum on emissions, and then concludes that the outcome is locked in, has the physics half right and the human agency exactly backwards. The forcing we can still move is precisely the one nobody is counting .
So those are the few points I wanted to add. None of this is a rebuttal of Tom, whose piece does what it sets out to do and does it well, and none of it is a rebuttal of attribution science, which is honest about the thing it measures. It is a request to widen the frame. The land surface is not a fixed backdrop against which the only interesting variable is the concentration of a gas. It is itself a forcing, of comparable size, structurally distinct, and unlike the gas, still within reach of a shovel and a headgate. Put that term in the ledger. Attribute through the circulation and the surface, not only through the thermometer. Do that, and the story stops being one of accumulating and irreversible doom, and starts being what the measurements actually support, which is a system we degraded on purpose and can, in many places and within a single generation, choose to restore.
My preprints and papers. Every DOI below resolves. Full record at ORCID 0009–0003–9709–4241.
The Vinalopó closed-basin analysis and the Loess Plateau reversibility analysis are in preparation. The 2022 Sindh decomposition in Figure 1 is my own analysis in ERA5; code available on request.
Originally published at https://r3genesis.substack.com.