How to Create 3D Boundary Walls on a Map
If you’ve ever worked with site layouts, you’ve probably noticed this, boundaries are always there, but they don’t always make sense at first glance.
On a map, they sit as thin outlines. When there are multiple plots close to each other, those lines start blending in. You end up zooming in, tracing edges, or explaining where one property ends and another begins, especially in industries such as real estate where site clarity matters.
It’s not that the information is missing. It’s just not clear enough.

Why 3D boundaries change how maps are read
Most maps do their job, but in real estate or planning, boundaries carry more than just visual meaning. They represent ownership, use, and spatial limits.
When they remain flat, that meaning gets lost. There’s no clear separation between sites, and everything sits on the same visual level.
Adding height changes how the map is read. Boundaries begin to act like edges that define space. Instead of interpreting lines, you start recognizing areas instantly.
From marking space to showing it
The shift from 2D to 3D boundaries isn’t about complexity. It’s a small change in how the same data is handled.
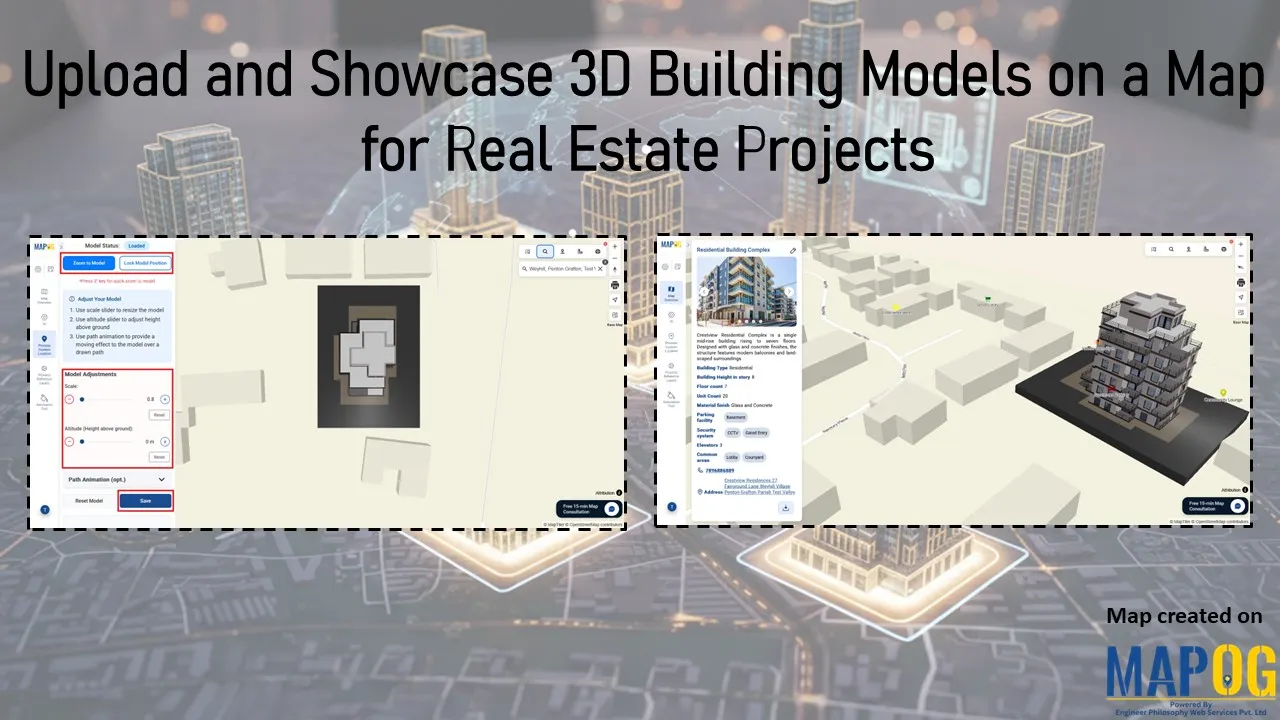
You start with a basic map, something structured enough to hold multiple sites without becoming cluttered. From there, boundaries are traced and given height. That alone makes a difference. What was earlier just an outline now starts defining space. Tools like MAPOG make this kind of transition straightforward without requiring a separate modelling process.

But it doesn’t stop there. A boundary without context still feels incomplete. Once you connect it to a property through a point, a label, or a simple attribute, it becomes easier to understand what that space represents.
Get Nitu Bhuyan’s stories in your inbox
Join Medium for free to get updates from this writer.
As more sites are added, the layout begins to make sense visually. You can rotate the view, tilt it, and see how each boundary sits in relation to the others. Even small adjustments like grouping properties or styling them help reduce the effort needed to read the map.
What you end up with is not just a cleaner layout, but something that explains itself.

Where this actually matters
This becomes useful in more places than you’d expect. On construction sites, it helps separate active areas from restricted ones. In energy projects, it clearly defines secured zones like solar installations or substations. Logistics setups use it to organize movement and storage, while infrastructure projects rely on it to distinguish between public and private spaces.
The use cases vary, but the need stays the same, clear boundaries that don’t need explanation.

A simple change that improves everything
3D boundary walls don’t add new data to a map. They just make existing data easier to understand.
With tools like MAPOG, creating them doesn’t require a complex setup. The process stays simple, but the outcome feels much more structured.
And in most cases, that’s enough. When the map is clear, everything built around it,planning, discussion, presentation, becomes easier.