Customer Churn Analysis in Excel

Understanding Why Customers Leave and How to Retain Them.
Introduction
Customer churn is one of the most critical challenges for any business, especially in competitive industries like banking. Churn happens when customers stop doing business with you. Every lost customer isn’t just lost revenue — it’s also the cost of acquiring and onboarding them, gone to waste.
In this analysis, I used Excel to explore real customer data from a bank, uncover patterns behind churn, and identify strategies to keep more customers happy and loyal.
Dataset Overview
The dataset includes details about each customer’s demographics, account information, and product usage. Some of the key variables I worked with include:
- Customer Age — To spot trends across age groups
- Balance — To see how account balances relate to churn
- Number of Products — The number of services a customer uses
- Is Active Member — Whether the customer engages with the bank regularly
- Exited — A flag showing if the customer has churned
- Complain — To spot if customers complained or not
- Satisfaction — To know the level of satisfaction of customers
- Card Type — To spot if a particular card type is associated to higher churn rate.
- Credit score — To evaluate if there is a correlation with customers leaving.

Methodology
Instead of relying only on raw filtering and pivot tables, I used DAX (Data Analysis Expressions) to create calculated measures in Excel’s Data Model. This allowed me to analyze the data dynamically and accurately.
Get Israel oladapo’s stories in your inbox
Join Medium for free to get updates from this writer.
Some of the key measures I built included:
- Total Customers — the overall customer base; Countrows(CustomerID)
- Churned Customers — customers flagged as “Exited = 1”;= Calculate(Total customers,exited=1)
- Retained Customers — customers still active (“Exited = 0”);= Calculate(Total customers,exited=0)
- Average Satisfaction — calculated using
AVERAGEin DAX for all customers; =Averag(satisfaction) - Average Tenure — average years with the bank;=Averag(Tenure)
- Average Age — mean customer age across the dataset;=Averag(Age)
By creating these measures in DAX, I could slice and filter the results by any dimension — age group, productNumber, Card type— without recalculating from scratch.


Visual Insights
The dashboard displayed:
Churn by credit score:
A coefficient of -0.44 indicates as Credit score increases, churn rate decreases although its not extremely strong but noticeable
Churn by Age :
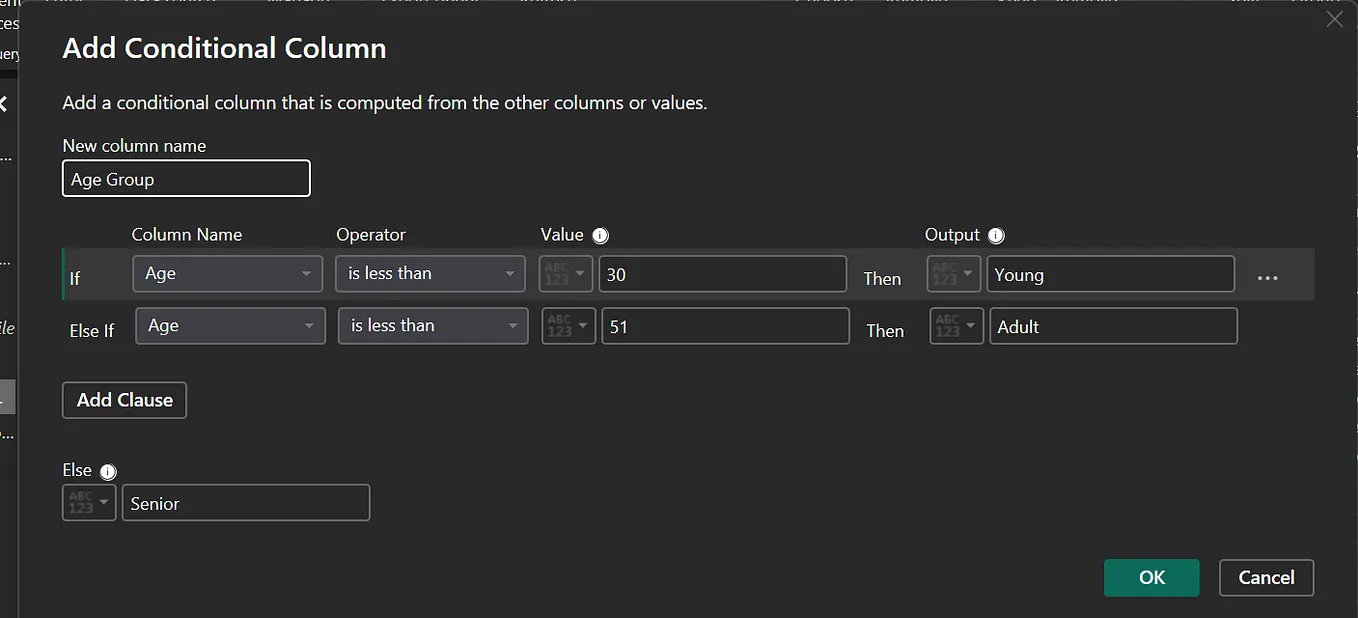
A coefficent of 0.50 indicate as Age increases, Churn rate increases. Older customers churn more often than younger customers.
Churn by Gender:
There are more Male than Female but there is higher Churn rate in Female than Male.
Churn rate by Location:
Germany ranked the second highest total population of (2059) but has the highest churn of (32.44%)
Churn rate by Complain :
About (99.51%) of customers that made complain left which can be the significant reason customers churned.
Churn rate by Product Number:
Product number 4 presents(100%) churn rate likewise Product Number 3 which recorded (82.71%) churn rate.
Recommendations for High-Risk Areas
- Improve Complaint Resolution
2. Reassess High-Churn Products
3. Focused Retention in Germany
4. Address Gender-Specific Needs
Thank you for reading.
My name is Israel and my goal is to provide Valuable insight that can enchance business growth.