On-Demand Transit Market Report — Midyear 2025


2024 was a year of light and shadow for the On-Demand Transit market:
More than 400 new project launches and over 1,300 active services demonstrated impressively the market’s continued expansion. At the same time, however, the European market — once a key growth driver — lost much of its momentum, which raises the question of the true size of the steady state market.
So, where does the market stand after the first six months of 2025? Let’s find out!
On-Demand Transit World Map (all projects)

On-Demand Transit World Map (active projects only)
Overall Market Trends — A Strong Start
2025 began with a particularly strong first quarter — the strongest ever recorded — with over 100 new project launches. A major driver of this growth was a flurry of service launches in Nova Scotia, Canada, where Blaise secured a regional, multi-service technology contract last year, with most services launching in January 2025. In contrast, the second quarter of 2025 was notably weaker — both compared to Q1 and to the same period in previous years. Both quarters combined, almost 180 new On-Demand Transit projects were launched in the first half of 2025.
Considering that Q1 was somewhat skewed by Nova Scotia’s outsized contribution to market growth, which is unlikely to be repeated at the same scale, the overall market trend may be less positive than the raw numbers suggest. Nevertheless, the first half of 2025 matched last year’s number of new service launches and can therefore be considered very strong.
In total, over 2,200 on-demand transit services have been launched since 2012, with close to 1,450 currently active.

It is important to put these numbers into context. During the same period, 80 projects ended, putting net market growth at +98 projects. While this is still a very strong figure, it also means that close to 45% of gross growth was offset by service terminations.
Geographically, the USA has been the top performer with 55 new services launching in Q1 and Q2 combined. Europe came second with more than 43 launches of which the biggest contribution came from Germany with 17 new launches. Canada, which claimed third spot, must be considered an outlier, and won’t be as high up in the ranking by the end of this year. Japan came in fourth with 28 launches followed by South Korea, which has been one of the stars of 2024 and saw the introduction of 10 new On-Demand Transit services.

Looking at net market growth on the geographical level, we get following picture:
- The USA recorded a +43 net growth — marginally down from +50 in Q1+Q2 2024.
- In Europe, the market grew by +27 net, which was almost exactly the same number in the same timeframe of last year.
- Perhaps counterintuitively, Japan — which broke all records in Q4 2024 with over 50 launches in a single quarter — stands at -15 net growth. This shows that Japan is still in a pilot-heavy phase, with many short-term projects that are, fittingly, referred to locally as “demonstration experiments.” I would caution against dramatising this result as Japan continues to be fully committed to on-demand transit and I expect that it will close 2025 with a positive result — albeit not as high as last year.
- The other outlier clearly is Canada. With +34 net growth in Q1+Q2 2025, Canada catapulted itself into the top league. As discussed before, main driver is the Nova Scotia Community Transportation Network program, which saw the launch of a large number of new services in January 2025. In contrast, Q2 provided an indication of Canada’s normal market dynamics with a net growth of just +1.
With regard to market segments, nearly all growth comes from the public sector — specifically public transit. In the first six months of 2025, 90% of all new projects were contracted by public transit agencies.
Waiting for the Next Big Thing — Solution Provider Market Update
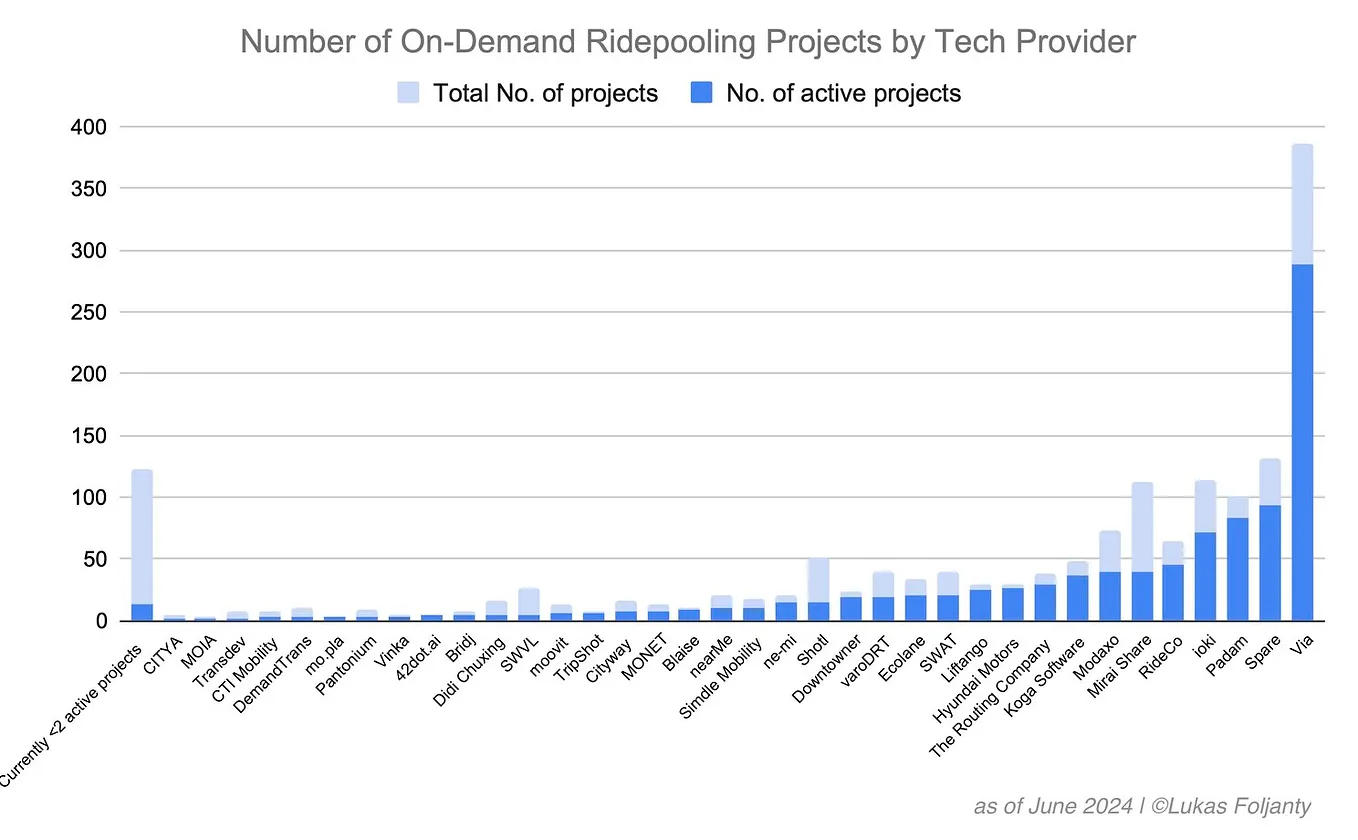
The technology and service provider market has remained highly competitive in recent years, with four distinct tiers still clearly identifiable.
- “The Vias”: With nearly 500 On-Demand Transit services launched, Via stands in a class of its own as the only true global player in this industry — though its level of dominance varies considerably across regions (see below). That dominance could grow even further once its recently filed IPO takes place (see below).
- “Runners-Up”: The five companies in this tier have each launched over 100 On-Demand Transit projects to date, with Spare leading in terms of project count — a position it successfully leveraged to raise fresh capital in September 2024. Overall, this tier is arguably the most competitive, as these companies must fend off both smaller players and the much larger Via in tender procedures, all while finding a path to profitability despite the relatively large headcounts many of them have built over the years.
- “The Local Specialists”: This is by far the largest and most diverse tier. Still, a recognizable pattern emerges among the more successful players: they focus on the specifics of select markets, adapt their products to local requirements, and rely on small, highly localized sales and support teams that enable them to build strong client relationships. Good examples include most Japanese companies, Blaise in Canada, Freebee in the USA, or Ne-Mi in Spain.
- “The Warriors of Old”: As new-generation on-demand tech providers push into paratransit and legacy DRT systems to keep their sales pipelines full — amid cooling enthusiasm for real-time optimized on-demand transit — the line between new- and old-generation providers is becoming increasingly blurred. My dataset still underrepresents the past successes of legacy providers, but in many countries (e.g., the Nordics) they continue to hold significant market share. And while they are starting to feel pressure from the new players, that doesn’t mean they will simply roll over. Quite the opposite: Voyagerr, for instance, demonstrated resilience by winning the Riyadh On-Demand Bus tender late last year.

The average number of service launches per quarter is a good indicator of who is on a streak and who might be on a downward slope — regardless of the total number of services launched. Unsurprisingly, Via stands in a class of its own, averaging nearly 19 launches per quarter over the past four years. Spare follows in second place with more than 10 launches per quarter on average, a figure that — as I discussed in my last article — was recently boosted by Next Mobility’s business development push in Japan, which Spare has been piggybacking on. With this in mind, and given that two more Japanese companies rank among the Top 10, the Japanese market demonstrates remarkable consistency. Combined with the two players from South Korea, East Asia has arguably been the market region with the most momentum in recent years. Another player worth noting is Blaise, which broke into the Top 10 thanks to an exceptionally high number of launches in Canada in Q1 this year — a position that may prove difficult to maintain over time.

Geographically, things have remained fairly consistent since my last report. Via hovers around the 25% global market share mark, though with varying results regionally. Its strongest market regions are Australia/New Zealand and MENA, while the most relevant ones remain North America and Europe. Asia, on the other hand, appears to be a lost battle for Via — unless it deploys some of the fresh capital from the announced IPO to regain ground there. Interestingly, the North American market now has only two solution providers with more than 10% market share, which I set as the minimum threshold for being explicitly highlighted in this chart. To be fair, RideCo — previously included in the chart — now stands at 9.9%. This means that 60% of the market is shared by just three solution providers. Perhaps even more strikingly, another 16 providers are competing for the remaining 40%. That’s what I call competitive!

A major provider-related news comes from Volkswagen’s MOIA subsidiary. After unveiling the production-ready autonomous ID.Buzz at the UITP Summit in Hamburg in June, MOIA has begun to openly discuss its pivot from an on-demand ridepooling mobility service provider to a technology provider for autonomous mobility service fleets aimed at international partners. MOIA’s own service in Hanover has already fallen victim to this shift, having been shut down in mid-July. While MOIA emphasizes its continued commitment to building an autonomous driving (AD) ecosystem in Hamburg — via the publicly co-funded “ALIKE” R&D project — I wouldn’t be surprised to see its driver-based ridepooling service in Hamburg disappear next.
As for MOIA’s pivot to an AD tech provider, it remains to be seen whether there’s long-term market potential for a turnkey package consisting of a single vehicle type (the relatively large ID.Buzz), paired exclusively to one AD stack (Mobileye), and middleware/implementation services (akin to what Beep offers). Their recently announced partnership with Uber in the U.S. suggests that such a market may exist. Then again, Uber currently partners with almost every major player in the AV space — and arguably has the resources and capability to develop its own middleware if it chooses to. In any case, by stepping away from controlling the demand side, MOIA is effectively abandoning the concept of pooled rides in favor of serving the individual robotaxi use case. That move makes sense if the company is positioning itself as a AV solutions provider — especially at a time when there’s growing momentum in the robotaxi space, but very little in autonomous public transport. Still, doubts remain about the long-term viability of MOIA’s strategic pivot.
But MOIA isn’t the only company eyeing the AV space: The Routing Company appears to hedging its bets beyond On-Demand Transit. According to TechCrunch, TRC has entered into a partnership with Zoox to provide routing technology for its robotaxi business. While TechCrunch frames this as TRC’s ‘first robotaxi client,’ LinkedIn activity from TRC staff suggests it may instead resemble an acquihire-style arrangement, potentially signaling that TRC is in the process of reevaluating its market strategy.
Another player I believe is worth keeping an eye on is HOLON. Strictly speaking, HOLON is not an on-demand transit solution provider, but their bus-like, purpose-built vehicle practically screams “use me for autonomous on-demand public transit!” In Hamburg, Germany — HOLON’s first public deployment — their people mover will be available on the MOIA platform. That’s quite an interesting pairing, considering MOIA is also an OEM-backed corporate venture that began with its own purpose-built vehicle before shifting its focus heavily toward software development and ultimately repositioning itself as an AV solution provider. Perhaps a blueprint for HOLON? If so, it would suggest that HOLON also needs an on-demand transit tech stack to offer turnkey services — whether through partnerships (such as the one recently announced with Lyft), in-house development, or M&A.
More provider-related rumors are making the rounds, so let’s see what other news surfaces during the rest of 2025.
Get Lukas Foljanty’s stories in your inbox
Join Medium for free to get updates from this writer.
And then there’s Via’s IPO…
Via’s Prospectus
Via finally filed for IPO with the SEC (again) and this time, we get to read the prospectus! And we learn that Via is not profitable (yet). Via managed to generate revenues of over US$335M in 2024 and looks poised to crack the $400M mark this year — assuming their growth trend continues. Very impressive! As industry expert Barak Sas points out, they need to grow their revenue to approx. US$550M to achieve operational profitability, assuming they can maintain their current 40% gross profit and keep the expenses constant. And that might become more challenging in a public sector market that’s showing signs of cooling down. The fresh capital from the IPO could help them push into new markets, expand capital-intensive lines of business, or pursue a more aggressive M&A strategy.
According to the prospectus, Via had close to 700 customers as of June 2025. That’s more than I capture in my dataset, but the figure includes Remix customers (of which I assume there are many) and a handful of Citymapper B2G clients. Unsurprisingly, 90% of revenue comes from public-sector business (B2G). Also unsurprisingly, 70% of revenue comes from North America and 30% from Europe. Mathematically, that means that the rest of the world only contributes marginally to Via’s top line — consistent with their regional market share (see above) and likely reflective of strategic expansion efforts supported by heavily discounted fees.
Another interesting detail: the cost of revenue consumes around 60% of total revenue, and roughly 85% of that stems from “technology-enabled services.” Although not explicitly disclosed, this is almost certainly tied to Via’s Operations-as-a-Service business (driver wages, vehicle financing, etc.). Personally, I could imagine Via using IPO capital to double down on this area and frame its growth story around autonomous fleet operations — similar to Moove’s recent US $1.2B debt raise. Because frankly, I struggle to see a compelling stock market case in the notoriously slow-moving, small-deal-size on-demand public transit sector, which shows signs of being past its peak.
And Via seems to be acknowledging as much in the “Risks” section of the prospectus where the company notes that its dependence on government contracts makes it vulnerable to spending caps and shifting budget priorities. Of course, risk disclosures are a formal requirement and not necessarily reflective of management’s expectations. Still, it’s noteworthy that they explicitly reference the Trump Administration’s policy shifts and budgetary constraints in Germany — both of which I highlighted in my last report as considerable market risks.
Finally, Via admits that the ridership performance of the on-demand services it powers (or operates) — though not always the agency’s primary goal or directly tied to Via’s revenue — can affect contract renewals and overall market confidence in On-Demand Transit. If performance disappoints, PTAs may hesitate to renew or may become increasingly doubtful of the concept itself. Which is a great segue to my analysis of on-demand service productivity below.
But irrespective of the long-term outlook and the risks involved, congratulations to Via on reaching this important milestone! Their IPO performance will be an important indicator of future investor appetite in the market.
Project Characteristics
Unlike in the early days of the on-demand ridepooling (sic!) market, the sector is now almost exclusively driven by the public sector. On-demand transit (sic!) accounts for over 90% of all newly launched projects in 2025 and approximately 82% of all currently active projects. The public transit segment is subdivided into several use cases, with on-demand neighborhood bus services representing the largest share at nearly 50%, followed by rural demand-responsive transport services, which make up around 35% of all public-sector projects.
Both of these use cases often arise in so-called “transit deserts,” where conventional public transit networks fail to provide adequate service prompting agencies to introduce alternative modes of public transportation. Consequently, the on-demand bus services serving these areas are usually small in fleet size due to low demand and often sparse population density in their operating areas. Most likely, the agency in charge is not expecting immensely strong performance figures from this kind of service as their agenda is the provision of a baseline level of public transportation.
But as Via rightfully notes in its prospectus, even if efficiency is not the primary goal, the performance of on-demand transit services remains a key metric to justify the expenses involved — and ultimately, their very existence. So where do we stand on this front? One way to measure efficiency is by looking at the average number of passengers per vehicle revenue hour (PAX/VRH). Using the most recent publicly available data I can find, I benchmark the performance of on-demand transit services across different parts of the world (see background on methodology). Examining 130 services from 22 countries, we find an average PAX/VRH of 2.38 — marginally higher (+0.04) than in my last report.

This benchmark can be broken down into three distinct tiers:
- The top tier, consisting of 14 services, achieved over 4 PAX/VRH — which I find very impressive. As noted in my previous reports, there is no clear pattern among these services (use case, location, demographics, etc.), which suggests that performance is driven more by service design and fare structure than by the technology deployed.
- 27 services demonstrated respectable performance with 3–4 PAX/VRH.
- However, 89 of the examined services achieved fewer than 3 PAX/VRH, which I define as the minimum threshold for plausibly arguing that on-demand transit is more efficient than other forms of public transit. More critically, 60 services delivered fewer than 2 PAX/VRH — representing over 45% of my entire sample.
As I often emphasize, efficiency is not necessarily the primary goal of public transit agencies when introducing on-demand transit services. However, given the very high operating costs of such services, it is not surprising that many agencies are critically evaluating their pilot programs and asking themselves whether a fully flexible mode of operation is truly the way forward. This could lead to more rigid service designs (e.g., mandatory pre-booking), a return to fixed-route services, or even the termination of the service altogether.
One of these cases is the on-demand subway elevator contingency bus service “Muva” in Berlin, Germany, which — as I predicted earlier — will not be continued beyond its contract term, after its open-to-all on-demand bus service was already prematurely discontinued in March this year. The paratransit-esk bus service will instead be replaced by taxis on a case-by-case basis, marking the end of on-demand transit in Berlin.
On the lower end of the spectrum, on-demand transit services often face scrutiny for their weak performance, with alternative modes — or even contracting taxis, as in Berlin — sometimes proving the more cost-effective option for agencies. But what about the upper end? As my benchmark shows, there are just over a dozen on-demand transit services achieving strong results of more than 4 PAX/VRH. These services likely stand a good chance of surviving, though it’s worth noting that high ridership doesn’t necessarily translate into profitability. For instance, the top-performing “LB Circuit” in Long Beach, CA, is a free-to-ride service, which only exists as long as the city is willing to pay for it.
Another point to consider: at more than 6 PAX/VRH, both “LB Circuit” and Dubai’s “Bus On Demand” are likely approaching the practical ceiling of what real-time pooled, on-demand transportation can deliver. As Andrew Miller aptly put it, “the curse of success” means that too much demand can become a serious operational and financial problem for on-demand transit.
This suggests that the “sweet spot” for on-demand transit efficiency lies somewhere in the range of 3 to 5 passengers per vehicle revenue hour. The interesting question, to me, is whether autonomous vehicles could meaningfully push that number higher, given the inherent operational constraints of pooled rides and riders’ relatively low willingness to pay. And if not, are these efficiency levels attractive enough for private-sector players to re-enter the market with autonomous on-demand ridepooling services? Uber and Lyft have recently reintroduced their pooled ridesharing services (with human drivers, though), which might suggest they see an opportunity in this segment. Then again, this is not their first attempt — and so far, even with their considerable financial firepower, no TNC has managed to build a sustainably viable ridepooling business.
Conclusions
With almost 180 new project launches, the first six months of 2025 have been very strong. Given the disproportionately high number of service launches in Canada at the beginning of the year, I would not expect the second half to be equally robust — but reflecting on Q4 2024, with over 110 launches in just one quarter, we might yet be surprised again.
Overall, the challenges of the market remain largely unresolved. In high-maturity regions, agencies are critically re-evaluating the viability of the concept once third-party funding is no longer available, especially in the context of budgetary constraints. I have no doubt that on-demand transit is here to stay, but the true size of the steady-state market is still unclear.
Autonomous driving could help boost the sector, but it also poses a serious risk if the individual “robotaxi” model prevails — which, at the time of writing this article, looks like the more likely scenario. More restrictive policies (e.g., AV fleet-size caps) could make pooling commercially necessary for private players. Yet one must ask why regulators should place obstacles in the path of AV ridesharing companies when such services could ultimately render bus networks off main transit corridors dispensable. To ensure mobility is not limited to commercially attractive areas at the most profitable fares, authorities could mandate that service areas include lower-demand zones as part of TNCs’ license to operate. Additionally, they could subsidize trips for socially disadvantaged groups — as is already happening in parts of the U.S. — which could also incentivize pooled operations. But — despite the impressive road miles accumulated by Waymo and others — AVs are not yet ready to be deployed at a scale that could meaningfully reimagine public transit networks and the role of transit agencies. This means that today’s on-demand transit services must continue to deliver the best possible quality and performance.
I expect 2025 to be another strong year for the market, but we are unequivocally approaching a crossroads for on-demand transit.
About this Report
Hi, my name is Lukas and I have been writing this series of reports on the state and outlook of the On-Demand Transit market since 2020. I would like to provide some background and context so that you know how to read this article:
- Between 2017 and 2024, I was working at a range of On-Demand Ridepooling solution providers (check out my LinkedIn profile if you are interested in which ones). I started this series of articles in response to the lack of data on this new market. It has always been a private project and was never part of my work at any of the On-Demand tech providers.
- The market is not so new anymore, but it prides me that my dataset, which is the basis for my reports, is still the most comprehensive source. This is to no small parts thanks to the On-Demand Transit community which has been extremely supportive by providing data and feedback.
- Nevertheless, all findings shared in the article should always be understood as informed indications, not hard facts. I invest many (many) hours before writing each edition of this report for updating my extensive dataset and try to be as diligent as I can. But there will be gaps and errors. If you notice either, please drop me a note!
- I try my very best to keep this report vendor-neutral. That will not stop me from expressing opinions about the state of the market or market participants (sometimes possibly provocative). However, should you ever have the impression that I am not being fair in how I present my findings, I appreciate if you send me a message and let me know.
- Possible deviations of facts and figures to previous articles of mine are most likely caused by retroactive additions to the dataset, which have been made possible in part by feedback and support from the On-Demand Ridepooling community. I appreciate the overwhelmingly positive and open response to my articles!
- The Google world map gets updated in the background, so it might show services which are not yet reflected in the analysis of this article.
- I use following terms synonymously: On-Demand Ridepooling, On-Demand Transit, On-Demand Transport, Microtransit, DDRT.
- The views expressed in this article are my own. They do not purport to reflect the opinions or views of my current employer.