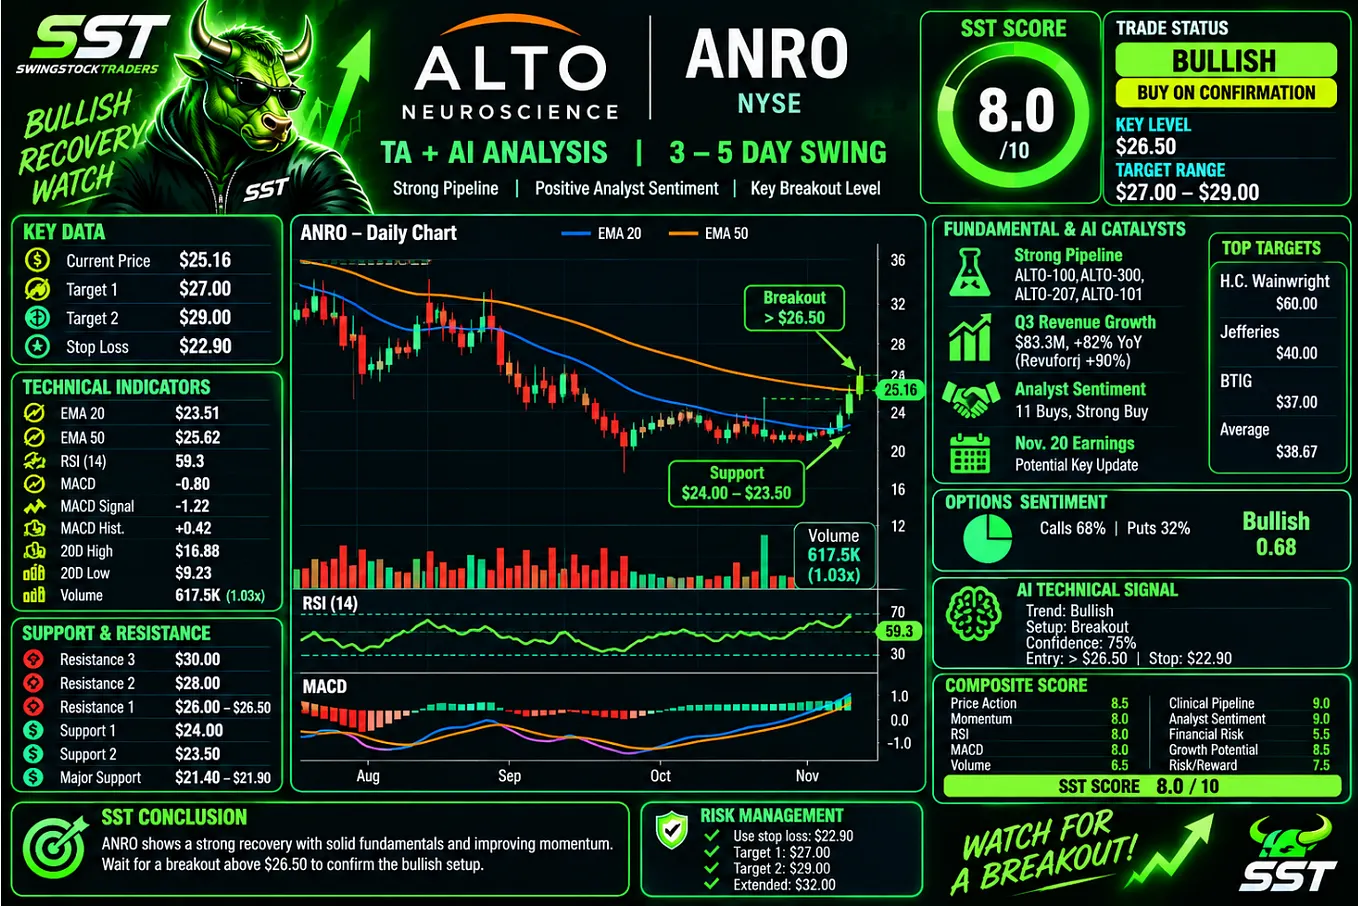
$VSH — TA-AI Swing Trading Analysis
Ticker: VSH
Company: Vishay Intertechnology
Latest close: $38.18 on October 2, 2026
TA-AI Signal: 🟢 BUY / Strong Momentum
SST-style Score: 86/100
VSH has produced a very strong technical breakout over the last two sessions: +5.28% on October 1 and +11.41% on October 2, with October 2 volume of approximately 8.79 million shares, almost double the recent average.
1. Price Momentum
VSH moved from around $29.63 on September 1 to $38.18 on October 2, an increase of roughly 29% in one month.
The most important development is the acceleration:
- Oct. 1: +5.28%
- Oct. 2: +11.41%
- Close: $38.18
- Intraday high: $38.94
This is a very strong momentum signature.
Signal: 🟢 Strong Bullish
2. Moving Averages
Using the recent daily price series, my TA calculation gives approximately:
IndicatorLevelSignalPrice$38.18🟢EMA 10$33.66🟢EMA 20$32.94🟢EMA 50*$33.37🟢
VSH is trading substantially above its short-term moving averages.
The particularly important signal is:
EMA20 > EMA50 and price >> EMA20
That indicates a strong short-term trend reversal/continuation.
Trend: 🟢 Strong Bullish
*The EMA50 calculation is based on the available recent historical series rather than a full multi-year data set.
3. RSI / Momentum
My calculated 14-day RSI is approximately:
RSI ≈ 84
That is very overbought.
This does not automatically mean SELL. In a strong momentum breakout, RSI can remain above 70 for several sessions.
However, it changes the trading strategy.
I would NOT chase VSH aggressively at $38+ after a +11% day.
Instead, I would look for either:
- a controlled pullback, or
- a continuation breakout above the October 2 high.
4. Volume Confirmation
This is one of the strongest parts of the setup.
October 2 volume:
8.79 million shares
compared with roughly 4–5 million shares on many recent sessions.
The price increase therefore has volume confirmation rather than being a low-volume move.
Get Ron Bergman’s stories in your inbox
Join Medium for free to get updates from this writer.
Volume signal: 🟢 Very Bullish
5. Resistance / Breakout
The immediate resistance is:
$38.90–$39.00
October 2 reached $38.94 intraday.
A decisive move above:
$39.00
would technically confirm another breakout.
Potential targets:
TargetPriceGain from $38.18Entry$37.00–$38.20 — Target 1$40.00+4.8%Target 2$42.00+10.0%Target 3$44.00+15.2%Target 4$46.00+20.5%
6. Pullback Scenario
This is where I think the best SST-style setup could develop.
Important support levels:
$35.00–$36.00
First support / breakout continuation zone.
$33.00–$34.00
Major short-term technical support, close to the EMA20/EMA50 area.
$31.50–$32.00
Deeper support and previous consolidation area.
If VSH pulls back toward $35–36 without a major deterioration in volume, I would consider that considerably more attractive than buying after an 11% daily explosion.
7. TA-AI Signal Matrix
FactorSignalScorePrice Momentum🟢 Strong Bullish95EMA Trend🟢 Strong Bullish92RSI🟡 Overbought70Volume🟢 Very Bullish94Breakout Structure🟢 Bullish91Support Structure🟢 Bullish82Short-term Risk🟡 Elevated67TA-AI Composite🟢 BUY86/100
🎯 SST TA-AI Trading Plan
Signal: 🟢 BUY
Preferred pullback entry:
$35.00–$36.50
Aggressive entry:
Above $39.00 with strong volume.
Stop-loss:
Approximately $33.50
Target 1: $40.00
Target 2: $42.00
Target 3: $44.00
For a 3–5 day SST swing, I would primarily focus on $40–$42.
🧠 Catalyst Confirmation
The technical breakout is also being supported by company developments. Vishay recently introduced four new 650V superjunction MOSFET power modules, targeting applications including solar inverters, charging stations and medical imaging.
Vishay also reported record Q2 2026 adjusted revenue of $919 million, above the top end of its guidance.
So the current move isn’t purely technical — the company has also produced positive operating/catalyst news.
🔥 Final TA-AI Verdict
VSH — BUY | TA-AI SCORE: 86/100
Trend: 🟢 Strong Bullish
Momentum: 🟢 Very Strong
Volume: 🟢 Excellent confirmation
EMA structure: 🟢 Bullish
RSI: 🔴 Overbought
Breakout: $39.00
Best pullback zone: $35.00–$36.50
Major support: $33.00–$34.00
3–5 day target: $40–$42
Extended target: $44+
AI conclusion:
VSH is currently one of the stronger momentum setups. The technical structure is clearly bullish, and the huge volume expansion confirms the breakout. However, an RSI around 84 and an 11% one-day gain make the stock extended. The preferred SST strategy is therefore NOT to chase the current spike, but to buy a controlled pullback toward $35–36.50 or a confirmed breakout above $39 with strong volume.