Building a GitHub Lakehouse on a Laptop: ELT with dlt + DuckDB + dbt

Part 1 of 3 in a series on OpenDevGraph, a zero-cost data pipeline built on GitHub’s public event firehose.
For Part 2 which focuses on Silver and Gold layers, click here. For Part 3 which focuses on automation, click here.
Over the last few weeks I’ve been taking every public event that happens on GitHub (every push, every pull request, every issue comment) and building it into a proper, layered data pipeline. Raw data sits in one tier, cleaned data in the next, business-ready tables in the last. Data engineers call this a medallion architecture, and the tiers get pretty obvious names: bronze, silver, gold. All of it runs on my laptop, for free, using three tools that don’t need a server: dlt to pull the data in, DuckDB to store and query it, dbt to transform it.
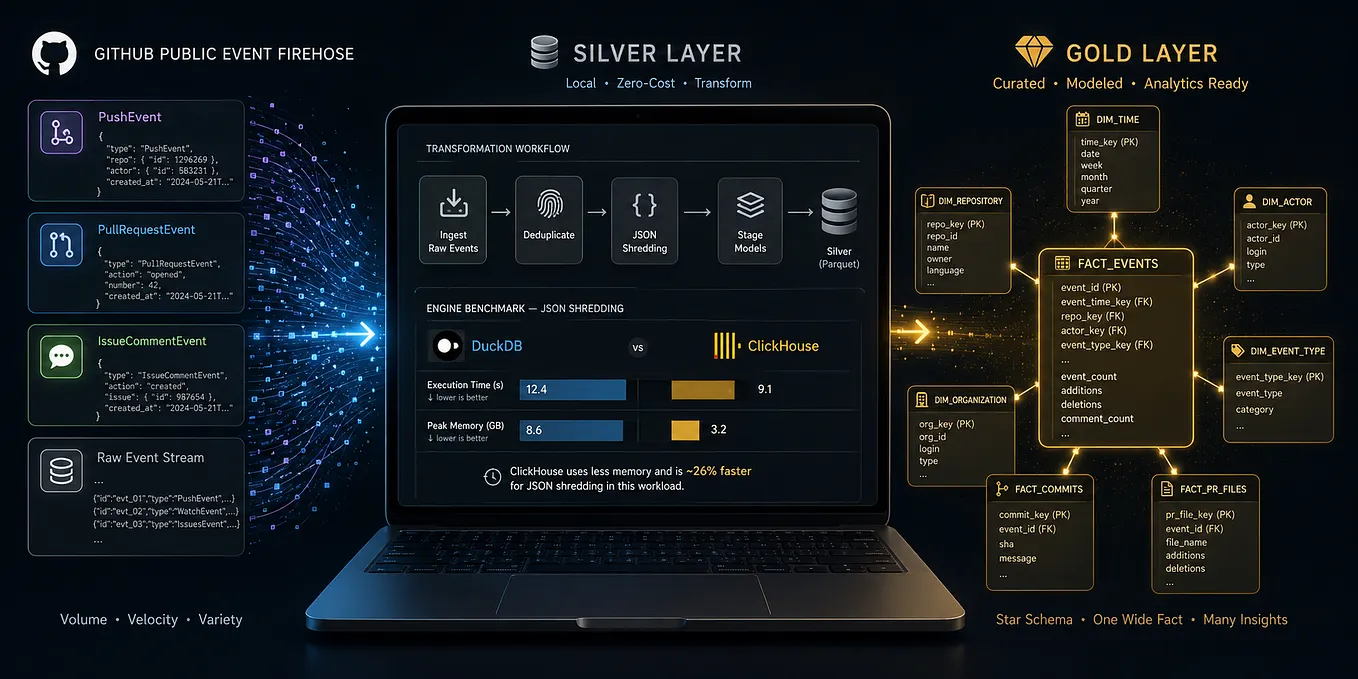
To visualize the flow of the project (and the data):

This first post is about getting raw data in cleanly and turning it into something more substantial. The bronze layer holds the raw data, both as storage and as the base on which other layers rest. The silver layer is the raw data refined. Part 2 builds the gold layer (a proper star schema) and runs a head to head benchmark between two database engines. Part 3 orchestrates the whole thing with Airflow, including a production bug that took real memory profiling to track down.
Why I’m doing this
As a comparatively new data engineer, the pull to understand various technologies, build pipelines I can genuinely be proud of, and just enjoy the process, is hard to resist. As a certified ClickHouse developer, I’ve had real hands-on practice with it across domains like data warehousing and observability. But to make sure I develop and retain an understanding of other widely used data engineering tools too, I’ve taken on projects that broaden the range of tools I’ve actually used, while also cementing the key concepts behind them, something that only comes from hands-on practice, not from watching tutorials.
Why a laptop, not the cloud
Partly this came down to cost, since a data warehouse in the cloud costs money and I wanted this to be a genuinely zero-budget project. But mostly it was a constraint I chose on purpose, because I didn’t want a managed service hiding the hard parts from me. If something breaks, it should break on my machine, for reasons I actually have to understand myself, and that ended up mattering more than I expected going in, which I’ll get into more in Part 3.
The hardware itself is a Lenovo Legion 5 with 16GB of RAM, running Ubuntu inside WSL2 on Windows, which is modest by cloud-warehouse standards but turned out to be good enough for millions of real rows a day, so long as I respected and abided by that ceiling, and respecting it took a few hard lessons to actually learn.
The data: GitHub’s public event firehose
GitHub publishes almost everything that happens on the platform (every push, pull request, star, issue, comment) as a public event stream, and a project called GH Archive records it, hour by hour, since 2011. These files are stored in a way that is easy to access, understand and download. Every hour is a single file, addressable directly, with no signup or API key required.
https://data.gharchive.org/2026-07-29-15.json.gz
That URL is literally the 3 PM UTC hour on July 29, 2026, and changing the date or hour in the path gets you a different file.
Each file is gzip compressed, newline delimited JSON, one line per event. A typical hour is around 100MB compressed, and a full day works out to somewhere around 4 million events. Decompress one line and this is roughly the shape you get, trimmed for length but structurally accurate to a real push event:
{
  "id": "48213xxxxx",
  "type": "PushEvent",
  "actor": {
    "id": 55501234,
    "login": "some-username",
    "url": "https://api.github.com/users/some-username"
  },
  "repo": {
    "id": 928421720,
    "name": "some-org/some-repo",
    "url": "https://api.github.com/repos/some-org/some-repo"
  },
  "payload": {
    "repository_id": 928421720,
    "push_id": 38377975770,
    "ref": "refs/heads/main",
    "head": "6a770ff245a74ae78c0a62320959517b13305473",
    "before": "63c39d32f89586e8f496410dd28959347c0069f1"
  },
  "public": true,
  "created_at": "2026-07-29T15:00:42Z"
}
Two things that jump right out, is that created_at is UTC (that Z at the end matters, I'll come back to this), and payload is a completely different shape for every event type. A push event's payload has ref, head, before . An Issue comment's payload has an entirely different set of fields nested several levels deep. That inconsistency is the single biggest design constraint of this whole project, and it's why the first real mistake happened the way it did.
Pulling it in: dlt
To get that raw JSON into something queryable, I used dlt (short for “data load tool”), a Python library, not a platform. Cross refering its documentation, writing the required syntax didn’t take much time, and required no server to run, no containers to orchestrate. The process couldn't be simpler: pip install dlt, write a function that yields data, tell it where to put it, done. That also fits the ELT approach this project follows. Instead of cleaning the data before it lands, as you would in a traditional ETL pipeline, the raw data is loaded first and transformed afterward inside the warehouse. The untouched copy remains available if something needs to be rebuilt or processed differently later.
Get Saarth Soni’s stories in your inbox
Join Medium for free to get updates from this writer.
Here’s roughly what the ingestion function looks like:
@dlt.source
def gh_archive_source(years, months, days, hours):
    @dlt.resource(name="github_events", write_disposition="append", max_table_nesting=0)
    def fetch_events():
        for hour in hours:
            url = f"https://data.gharchive.org/{year}-{month:02d}-{day:02d}-{hour}.json.gz"
            response = requests.get(url, stream=True)
            if response.status_code == 404:
                continue  # GH Archive has real gaps, tolerate them
            with gzip.GzipFile(fileobj=response.raw) as gz_file:
                for line in gz_file:
                    if line.strip():
                        yield json.loads(line.decode("utf-8"))
    return fetch_events()
Mistake one: 556 columns
My first run didn’t include that max_table_nesting=0 argument shown above. By default, dlt flattens nested JSON into columns automatically. That is useful in plenty of cases, but GitHub event payloads are a particularly bad fit for it. Every event type brings its own structure, so without limiting the nesting depth, dlt dutifully created a column for every field it encountered across every event type.
The result was a bronze table with 556 columns.
Most of them were NULL for any given row. A push event has no value for an issue event’s labels field, and an issue event has no use for most push-specific fields. Every query became a wide, mostly empty scan, and the schema itself became nearly unreadable, since you couldn’t tell at a glance which of those 556 columns actually mattered for which rows.
Setting max_table_nesting=0 fixed that by keeping nested fields as they arrived instead of flattening them automatically, exactly like the actor, repo, and payload fields. Bronze collapses down to a clean ten columns: id, type, actor, repo, payload, public, created_at, org, plus a couple of dlt's own bookkeeping fields. The type-specific unpacking of payload still needs to happen eventually, that's what silver is for, but now it happens on purpose, later, in dbt, where I can see exactly what's going on.
Mistake two: idempotency isn’t automatic
write_disposition="append" does exactly what the name says, it appends. That also means re-running the same date range, even partially, gives you duplicate rows without warning. I hit this directly during an early attempt to backfill three days in one go, where some retry logic in the mix ended up roughly tripling one day's row count before I even noticed something was wrong. A count that should have read around 4 million read closer to 12 million, for a single day.
The fix was to ingest one day at a time, verify the row count before moving on to the next, and never let date ranges overlap.
Mistake three: the UTC bug that got me three separate times
This is the one I’d flag hardest to anyone building something similar. That Z at the end of created_at means the timestamp is genuinely UTC. But DuckDB's naive CAST(created_at AS DATE) ended up applying the local timezone (IST, GMT + 5:30) before reducing the timestamp to a calendar date. The result was that the last five and a half hours of every UTC day moved into the next date.
I hit this three separate times, in three different places, across this project: once double-checking daily bronze counts, once building models downstream, and once in a later join where it silently produced hundreds of thousands of rows with no matching date, because they’d been shifted right past the edge of what I’d expected. The way to fix this is to explicity mention the time zone:
CAST(created_at AT TIME ZONE 'UTC' AS DATE)Getting ready for silver and gold
Once verified that the raw data was arriving appropriately, the next step was setting up the tools that would actually clean and shred this data: DuckDB as the query engine, and dbt to define the transformations as version controlled SQL instead of one off scripts.
pip install duckdb dbt-core dbt-duckdbPart 2 picks up from here, turning this raw event stream into a proper star schema with fact tables and dimensions that track history over time, plus a head to head benchmark between DuckDB and ClickHouse for the messier parts of the transformation.