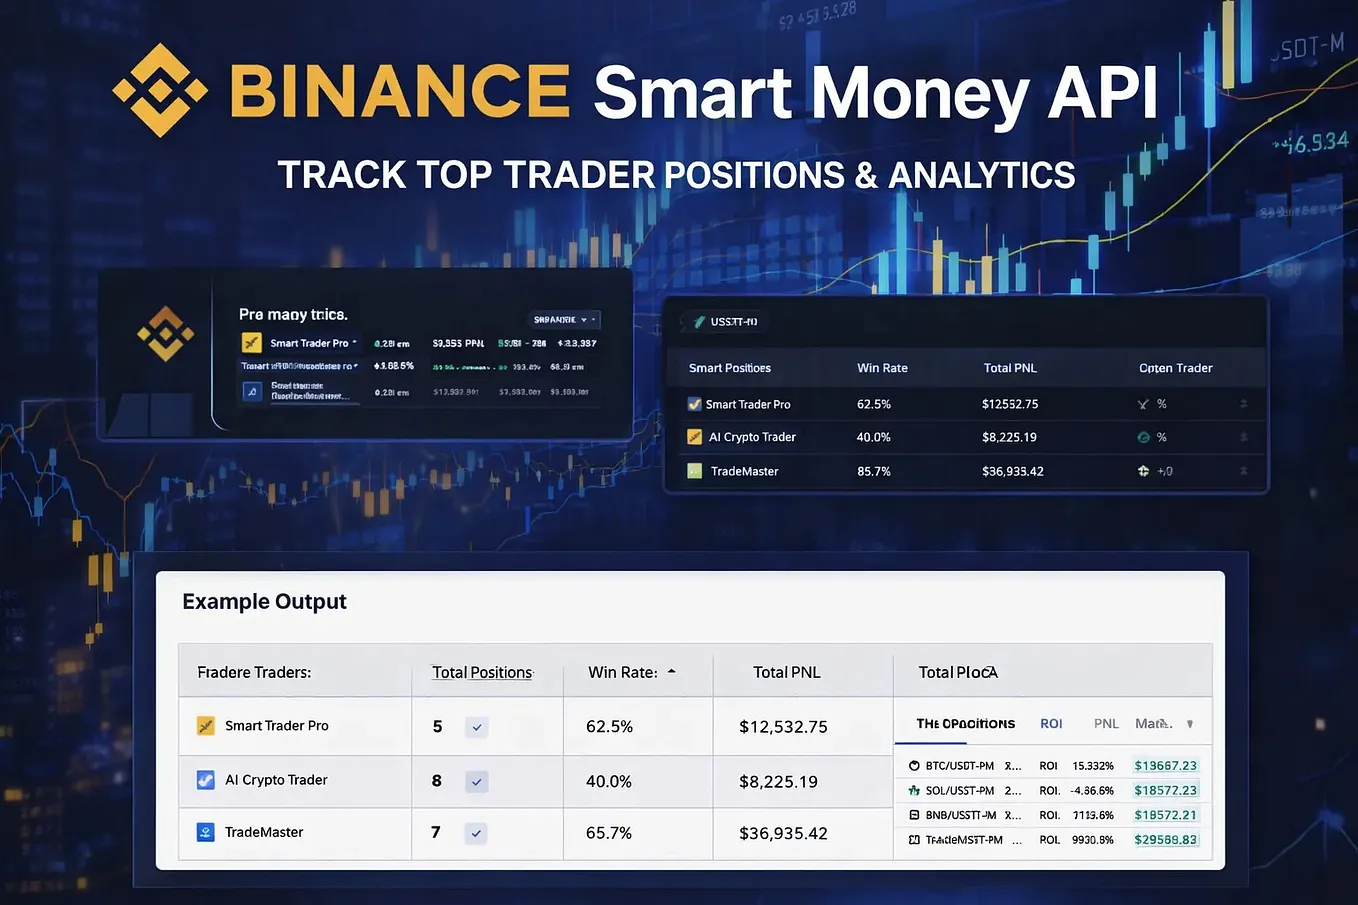
Building a Binance Futures Smart Money Analytics Platform With Trader-Level Data


Most cryptocurrency trading dashboards focus on the same information:
Price. Volume. Open Interest. Funding Rates. Liquidations.
All of these metrics are useful.
But there is another question that can be equally interesting:
What are individual Binance Futures traders actually doing?
Which traders are currently active?
What positions are they holding?
Are they long or short?
How has their PnL changed?
Can we monitor multiple traders at the same time?
These questions lead to an interesting area of crypto development: trader-level analytics.
In this article, we’ll explore how developers can use Binance Futures trader data to build smart money analytics applications.
What Is Smart Money Analytics?
The term “smart money” is commonly used to describe experienced or strategically important market participants.
A smart money analytics application doesn’t necessarily need to copy their trades.
Instead, it can focus on collecting, organizing and visualizing trader activity.
For example, an application could show:
Trader A
BTCUSDT → LONG
Trader B
ETHUSDT → SHORTTrader C
BTCUSDT → LONG
SOLUSDT → LONG
Combine that with historical PnL and trader profile information, and you can create a much more complete view of trader behavior.
Why Trader-Level Data Is Interesting
Traditional market data answers questions like:
What is Bitcoin doing?
Trader-level data can help answer:
What are specific traders doing?
That’s a completely different perspective.
A developer could combine:
Market Data
      +
Trader Data
      +
Historical Performance
      ↓
Crypto Analytics Platform
This creates opportunities for applications that go beyond simple price charts.
The Three Core Pieces of Trader Data
A useful trader analytics platform can start with three basic data sources.
1. Trader Profile
Information associated with a particular trader.
2. Historical PnL
Performance data that can be visualized over a selected period.
3. Current Positions
The futures positions currently associated with the trader.
Together, they can form the foundation of a trader analytics dashboard.
1. Trader Profile Data
The first component is trader profile information.
An API endpoint can be used to retrieve information for a specific trader:
GET /v1/getTraderProfileFor example, a Node.js application can request the data using Axios:
const axios = require("axios");const HOST =
"binance-futures-smart-money-api.p.rapidapi.com";async function getTraderProfile(traderId) {
const response = await axios.get(
`https://${HOST}/v1/getTraderProfile`,
{
params: {
traderId
},
headers: {
"X-RapidAPI-Key":
process.env.RAPIDAPI_KEY, "X-RapidAPI-Host":
HOST
}
}
); return response.data;
}
The returned information can then become the profile section of a dashboard.
For example:
--------------------------------
        TRADER PROFILE
--------------------------------
Trader ID
4567039936116284160Performance
...PnL
...Trading Information
...--------------------------------
2. Historical PnL Data
The next component is historical performance.
The API endpoint is:
GET /v1/getTraderChartDataA request can specify a trader, time range and chart data type.
For example:
const response = await axios.get(
  `https://${HOST}/v1/getTraderChartData`,
  {
    params: {
      traderId:
        "4567039936116284160",
timeRange: "30D", chartDataType: "PNL"
}, headers: {
"X-RapidAPI-Key":
process.env.RAPIDAPI_KEY, "X-RapidAPI-Host":
HOST
}
}
);
The returned data can then be passed to a charting library.
A dashboard could visualize it as:
PnL
 │
 │                   ╭─────╮
 │              ╭────╯     ╰──
 │         ╭────╯
 │    ╭────╯
 │────╯
 └─────────────────────────────
              Time
This makes it easier to understand performance trends.
3. Current Trader Positions
The third piece is current trader position data.
The endpoint is:
GET /v1/getTraderPositionsA request could look like:
const response = await axios.get(
  `https://${HOST}/v1/getTraderPositions`,
  {
    params: {
      marketType: "UM",
      page: 1,
      rows: 9,
      traderId:
        "4555301953191358864"
    },
headers: {
"X-RapidAPI-Key":
process.env.RAPIDAPI_KEY, "X-RapidAPI-Host":
HOST
}
}
);
The application can then transform the returned data into a positions table.
For example:
----------------------------------------
          CURRENT POSITIONS
----------------------------------------
BTCUSDT LONG
Entry Price ...ETHUSDT SHORT
Entry Price ...SOLUSDT LONG
Entry Price ...----------------------------------------
Now we have three different layers of information.
Bringing Everything Together
The interesting part isn’t necessarily any single endpoint.
It’s what happens when you combine them.
TRADER ID
                     │
        ┌────────────┼────────────┐
        │            │            │
        ▼            ▼            ▼
     PROFILE        PNL       POSITIONS
        │            │            │
        └────────────┼────────────┘
                     ▼
             TRADER ANALYTICS
                     │
                     ▼
                DASHBOARD
This creates a much richer trader experience.
What Could the Dashboard Look Like?
Imagine opening a trader’s profile and seeing:
┌────────────────────────────────────┐
│         BINANCE FUTURES            │
│          TRADER ANALYTICS          │
├────────────────────────────────────┤
│                                    │
│ Trader Profile                     │
│                                    │
├────────────────────────────────────┤
│                                    │
│ Historical PnL                     │
│                                    │
│       ╭──────────────╮             │
│  ╭────╯              ╰──────       │
│──╯                                 │
│                                    │
├────────────────────────────────────┤
│                                    │
│ Current Positions                  │
│                                    │
│ BTCUSDT       LONG                 │
│ ETHUSDT       SHORT                │
│ SOLUSDT       LONG                 │
│                                    │
└────────────────────────────────────┘
Instead of looking at raw JSON responses, users get an actual analytics interface.
Monitoring Multiple Traders
The next step is to monitor multiple traders.
For example:
Trader A
Trader B
Trader C
Trader D
Trader E
Your backend can periodically retrieve their data.
Get Mayank Singh’s stories in your inbox
Join Medium for free to get updates from this writer.
The dashboard could show:
Trader       BTC       ETH       SOL
--------------------------------------
Trader A     LONG      -         LONG
Trader B     SHORT     LONG      -
Trader C     -         SHORT     LONG
Trader D     LONG      LONG      -
Trader E     -         LONG      SHORT
This creates a simple smart money watchlist.
Detecting Position Changes
One of the most interesting features would be position-change detection.
Imagine your application retrieves:
10:00 AM
BTCUSDT → LONG
Then later:
11:00 AM
BTCUSDT → LONG
And eventually:
12:00 PM
BTCUSDT → SHORT
Your application can compare the latest snapshot with the previous snapshot.
The logic becomes:
API Request
     ↓
Current Position
     ↓
Compare With Previous Position
     ↓
Position Changed?
     ↓
Yes
     ↓
Create Event
That event could then be stored in a database or used to trigger an application notification.
Building Historical Trader Data
A powerful extension is to store snapshots over time.
For example:
10:00 → BTC LONG
11:00 → BTC LONG
12:00 → BTC SHORT
13:00 → BTC SHORT
14:00 → BTC LONG
After weeks or months, the application could have its own historical trader dataset.
That opens up additional possibilities:
- Position-change analysis
- Trader behavior analysis
- Historical comparisons
- Performance research
- Long/short behavior
- Trader ranking systems
The API becomes the data source while your own database becomes the historical analytics layer.
Combining Trader Data With Market Data
Trader data becomes even more interesting when combined with traditional market data.
For example:
BTC Price
     +
Trading Volume
     +
Open Interest
     +
Trader Positions
     +
Trader PnL
This could create a much more comprehensive crypto analytics platform.
For example, you could analyze whether a group of monitored traders tends to increase their BTC exposure during certain market conditions.
That moves the application from a simple dashboard toward a research platform.
Possible Applications
There are many applications that can be built around this type of data.
Smart Money Tracker
Monitor selected traders and display their current positions.
Trader Analytics Dashboard
Show profile information, PnL and positions in one interface.
Trader Comparison
Compare multiple traders based on available performance information.
Position Monitoring
Detect changes in trader positions.
Research Platform
Store historical snapshots and analyze trader behavior.
Trader Watchlist
Allow users to select traders they want to follow.
Notification System
Trigger notifications when selected trader activity changes.
A Simple Backend Architecture
A production application could eventually look like this:
FRONTEND
                      │
                      ▼
                YOUR BACKEND
                      │
          ┌───────────┼───────────┐
          │           │           │
          ▼           ▼           ▼
       PROFILE       PNL      POSITIONS
          │           │           │
          └───────────┼───────────┘
                      ▼
                   DATABASE
                      │
                      ▼
                ANALYTICS ENGINE
                      │
                      ▼
                 USER DASHBOARD
This architecture separates the frontend from the API credentials and gives developers a place to process and store historical data.
Security Matters
If you’re building an application with RapidAPI, don’t expose your API key in frontend JavaScript.
Never do this:
const API_KEY =
  "YOUR_REAL_RAPIDAPI_KEY";
Instead:
const API_KEY =
  process.env.RAPIDAPI_KEY;
Your backend should communicate with RapidAPI.
The frontend should communicate with your backend.
Frontend
   ↓
Your Server
   ↓
RapidAPI
This keeps your credentials away from the browser.
The Binance Futures Smart Money API
I’ve been working on a Binance Futures Smart Money API designed around trader-level data.
The API currently provides three core endpoints:
Trader Profile
GET /v1/getTraderProfileTrader Chart Data
GET /v1/getTraderChartDataTrader Positions
GET /v1/getTraderPositionsThe endpoints can be used individually or combined to create a trader analytics application.
You can explore and test the API through RapidAPI:
https://rapidapi.com/singhmayankms123/api/binance-futures-smart-money-api
What I’d Build Next
If I were building a product around this API, I wouldn’t stop at displaying current positions.
I’d gradually add:
1. Trader Watchlists
Users select the traders they want to monitor.
2. Historical Position Tracking
Store periodic snapshots.
3. Position Change Detection
Identify when positions change.
4. PnL Visualization
Display historical trader performance.
5. Trader Comparison
Compare several traders.
6. Notifications
Alert users about meaningful changes.
This turns a basic API integration into a complete trader analytics product.
Final Thoughts
Crypto applications don’t have to focus exclusively on market prices.
There is another layer of information that developers can build around: trader-level data.
By combining:
Trader Profiles
Historical PnL
Current Positions
developers can create applications for trader analytics, smart money research, position monitoring and cryptocurrency dashboards.
The important part is not simply collecting the data.
It’s turning that data into something that helps users understand trader behavior.
The Binance Futures Smart Money API is designed to provide the underlying trader data that developers can build on.
If you’re building a Binance Futures analytics project, trader-level data can be an interesting starting point for creating something beyond a traditional price dashboard.
Explore the API:
https://rapidapi.com/singhmayankms123/api/binance-futures-smart-money-api