🌧️ Is It Getting Drier?

What do 40+ years of rainfall data really tell us? Are we on a drying trend, and how might the next few seasons play out? Let’s unpack it together.
Why look at trends?
When a farmer says, “The rains aren’t what they used to be,” they’re pointing to a long-term pattern we can actually test. Kenya’s March–May “long rains” are critical for maize, beans, and hydropower supply. Detecting changes isn’t just academic; it informs everything from seed choice to national water policy.
1. Testing for trends
Two robust methods are used:
a) Mann-Kendall tau test
A non-parametric test checks for a monotonic trend (up or down) without assuming a specific shape. It’s popular in climate science because rainfall data are noisy and non-linear.
b) Sen’s slope
If a trend is found, Sen’s slope estimates its size. For example, “+5 mm per year.” Even a small slope can stack up over decades.
from scipy import stats

# Mann-Kendall tau
tau, p = stats.kendalltau(season_df.year, season_df.total_mm)

# Sen’s slope
slope = stats.theilslopes(season_df.total_mm, season_df.year)[0]

if p < 0.05:   # If p < 0.05, Sen estimates the yearly change.
    print(f"⭑ Trend: {slope:+.1f} mm/year (τ={tau:.2f}, p={p:.3f})")
else:
    print(f"No significant monotonic trend (p={p:.2f}).")

# Rolling 10-year mean
season["roll10"] = season.total_mm.rolling(10, center=True).mean()
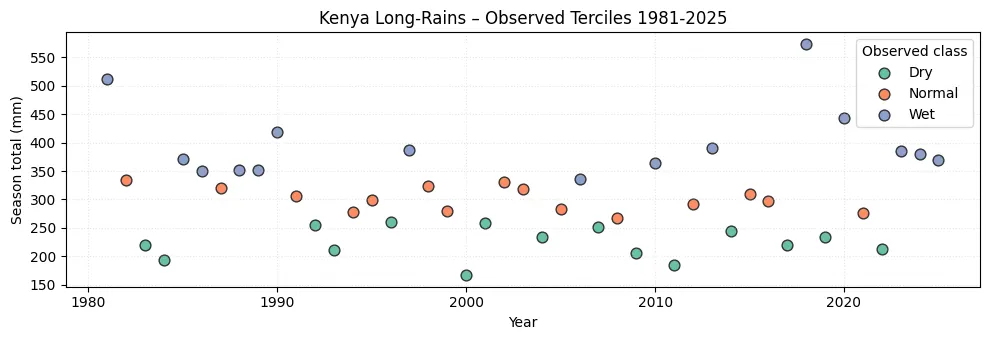
Finding: τ ≈ 0.10, p > 0.10 → no statistically significant monotonic trend. The Sen line tilts slightly upward (~+4 mm yr¹), but not enough to shout “wetter climate” yet.
c) Rolling 10-year mean
Sometimes eyes catch what tests miss. To visualise subtle shifts, we overlay a smoothed 10-year moving average atop raw year-by-year totals.

The Result: No strong monotonic trend, but small upward “wiggles” suggest a possible gentle wetting tendency.
Get Sophia Mbataru’s stories in your inbox
Join Medium for free to get updates from this writer.
⚖️ Interpret carefully! A non-significant trend doesn’t mean no change. It just means the signal isn’t strong enough to be statistically confident yet.
2. Forecasting with ARIMA
If trend tells us about the past, forecasting nudges us into the future.
Why ARIMA?
When you only have one variable (rainfall), ARIMA remains a solid baseline. ARIMA (AutoRegressive Integrated Moving Average) models are like a memory-based predictor: they use past values (auto-regression), correct for drifts (integration), and smooth out noise (moving average).
from statsmodels.tsa.arima.model import ARIMA

series = season_df.set_index("year")["total_mm"].asfreq("AS-MAR")
series = series.interpolate()

model = ARIMA(series, order=(1, 0, 0)).fit()
fc = model.get_forecast(steps=3)
print(fc.summary_frame())
3. Static vs Rolling Predictions
Static = train once → predict many years. For example, predicting average global temperature increase over the next 30 years.
Rolling = re-train each year → predict next. For example, forecasting average temperature and precipitation for the next 12 months, then updating the forecast every month as new data becomes available.
4. ARIMA, Prophet, or Sub-Seasonal (S2S)?
|   Model   |            Pros                             |         Cons                      |
| ----------| --------------------------------------------| --------------------------------- |
| ARIMA     | Light, transparent, tiny data need          | Ignores climate drivers           |
| Prophet   | Handles multiple seasonalities easily       | Facebook libraries ≈ heavy        |
| S2S ECMWF | Knows about real climate dynamics (ENSO,IOD)| Computational heavy               |
Think of ARIMA as a baseline, Prophet as a flexible friend, and S2S as a muscle car (but fuel-hungry).
5 · What Do We Tell Stakeholders?
- No dramatic drying trend — yet.
- Next three seasons: forecast suggests average-to-slightly-wetter, with model 95% confidence intervals spanning ±150 mm above or below the mean prediction.
- Action lens: keep drought contingency funds but delay emergency releases; encourage diversified seed varieties.
6 · Try It Yourself
Clone the repo → python east_africa_monsoon_project.py --forecast-only
Rerun with your country’s bounding box (--bbox S N W E) to localise.
Up Next
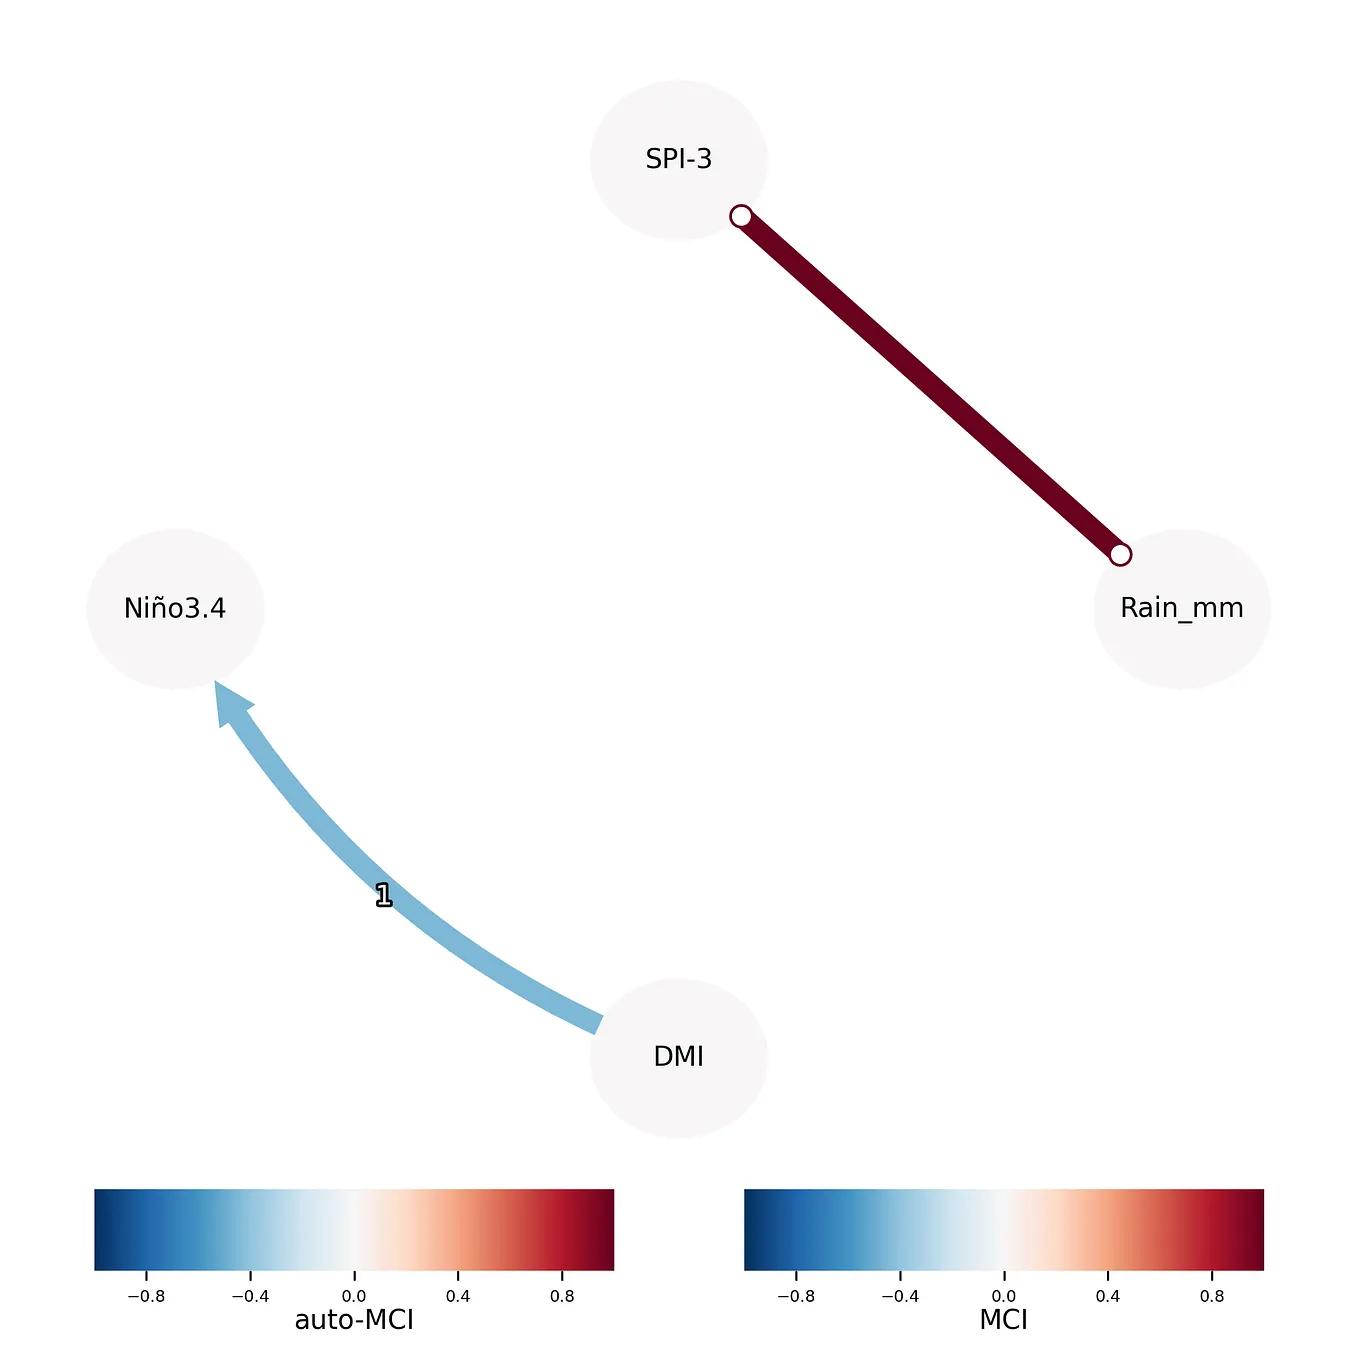
In the next post (Link), we dive into lagged climate drivers and PCMCI causal discovery, asking, “What hidden climate signals drive our rains?”