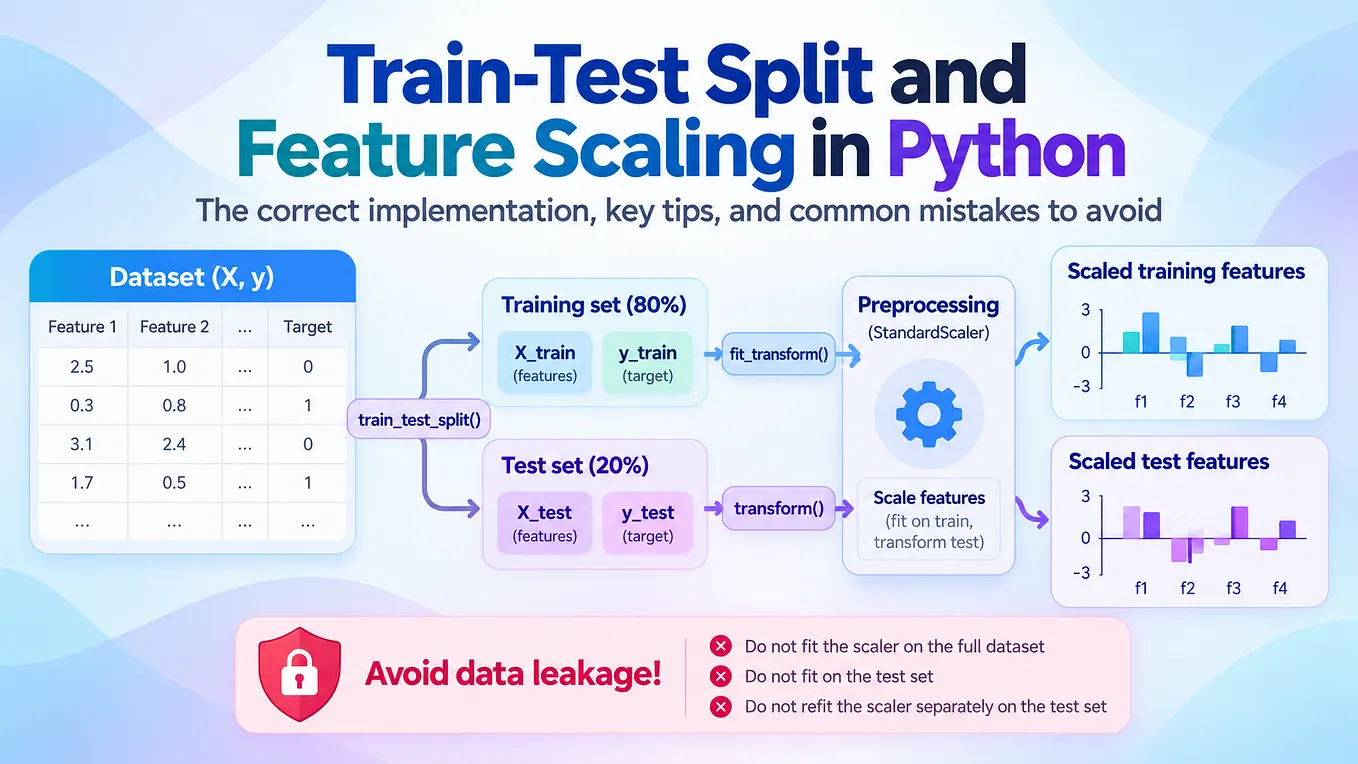
Why Machine Learning Needs Feature Scaling: A Beginner-Friendly Guide


Imagine you are building a Machine Learning model to compare different houses.
Your dataset looks like this:
| House Size | Number of Rooms | Distance to City |
|------------|-----------------|------------------|
| 1500 sq.ft | 3               | 5 km             |
| 2200 sq.ft | 4               | 8 km             |
| 3000 sq.ft | 5               | 12 km            |
Look at the numbers carefully.
House Size → 1500, 2200, 3000
Rooms → 3, 4, 5
Distance → 5, 8, 12
There is a big difference between their number ranges.
House size is in the thousands, while the number of rooms is only around 3–5.
For us, this is not confusing. We know that 3000 sq. ft and 5 rooms represent completely different things (Because they have units like sq.ft, km, Room Number).
But some Machine Learning algorithms mainly work with numbers (They can’t deal with units where human used to).
And that can create a problem.
What’s the Problem?
Imagine the computer is comparing two houses.
The differences might be:
House Size difference = 800
Room difference       = 1
Distance difference   = 3
Look at those numbers:
800
1
3
800 is huge compared with 1 and 3.
So some Machine Learning algorithms may be influenced much more by House Size simply because its numbers are larger.
But larger numbers don’t necessarily mean a feature is more important.
That’s where Feature Scaling comes in.
What Is Feature Scaling?
Feature Scaling simply means:
Changing the numerical ranges of features so they can be compared more fairly(taking everything into one scale).
For example, before scaling:
House Size → 1500, 2200, 3000
Rooms      → 3, 4, 5
Distance   → 5, 8, 12
After scaling, we might get something like:
House Size → 0.0, 0.47, 1.0
Rooms      → 0.0, 0.5, 1.0
Distance   → 0.0, 0.43, 1.0
Now the features are on similar scales.
That’s the main idea behind Feature Scaling.
⚠️ One Important Thing to Remember
Feature Scaling happens column by column.
Suppose we have:
| Size | Rooms | Distance |
|------|-------|----------|
| 1500 | 3     | 5        |
| 2200 | 4     | 8        |
| 3000 | 5     | 12       |
We scale:
Size column ↓
1500
2200
3000
Then:
Rooms column ↓
3
4
5
Then:
Distance column ↓
5
8
12
Each column is scaled separately.
❌ We don’t scale one house at a time.
✅ We scale one feature/column at a time.
How Do We Scale Features?
There are two common methods:
1. Normalization
2. Standardization
Don’t worry about the names. The ideas are quite simple.
1️⃣ Normalization — Put Values Between 0 and 1
Normalization usually changes the values of a feature so that they fall between:
0 → 1Imagine delivery distances:
2 km
6 km
10 km
After normalization, they become:
2 km  → 0.0
6 km  → 0.5
10 km → 1.0
The smallest value becomes 0.
The largest value becomes 1.
Values between them get numbers somewhere between 0 and 1.
The formula

Normalized Value = (Value - Minimum) / (Maximum - Minimum)For example, let’s normalize 6.
Our values are:
2, 6, 10Minimum = 2
Maximum = 10
So:
(6 - 2) / (10 - 2)= 4 / 8= 0.5
That’s it!
Easy way to remember
Normalization → Put everything between 0 and 1.
2️⃣ Standardization — Compare Values With the Average
Standardization works a little differently.
Instead of using the smallest and largest values, it asks:
How far is this value from the average?
For this, we need two things:
Mean and Standard Deviation.
Mean is easy.
Mean simply means average.
But what is Standard Deviation?
What Is Standard Deviation?
The name sounds complicated, but the idea is simple.
Standard Deviation tells us how spread out our values are around the average.
Imagine two groups of delivery times.
🟢 Group A
28 min
29 min
30 min
31 min
32 min
Average ≈ 30 minutes
Everyone is close to the average.
28  29  30  31  32
        ↑
      Average
The values are close together.
👉 Small Standard Deviation
🔴 Group B
Now imagine:
10 min
20 min
30 min
40 min
50 min
The average is still:
30 minutesBut now the values are much more spread out.
10       20       30       40       50
                  ↑
                Average
Some values are far away from the average.
Get Suneth Nawoda De Silva’s stories in your inbox
Join Medium for free to get updates from this writer.
👉 Large Standard Deviation
So remember:
Small Standard Deviation → values are close to the average.
Large Standard Deviation → values are spread far from the average.
That’s all you need to understand for now.
For further reading on Standard Deviation, you can follow this post :
📊 So, How Does Standardization Work?
The formula is:

Standardized value = (Value - Mean) / Standard DeviationLet’s use a simple example.
Suppose:
Average = 50
Standard Deviation = 10
We want to standardize:
60First, subtract the average:
60 - 50 = 10Then divide by the Standard Deviation:
10 / 10 = 1So:
60 → 1What does 1 mean?
It means:
60 is one standard deviation above the average.
What about 40?
(40 - 50) / 10= -10 / 10= -1
So:
40 → -1That means:
40 is one standard deviation below the average.
And what about 50?
(50 - 50) / 10= 0So the average becomes:
50 → 0A simple way to think about it:
Below Average Average Above Average -1 ←────────── 0 ──────────→ +1Normalization vs Standardization
Here’s the easiest comparison:
| Normalization                       | Standardization                |
|-------------------------------------|--------------------------------|
| Usually puts values between 0 and 1 | Centers values around 0        |
| Uses Minimum & Maximum              | Uses Mean & Standard Deviation |
| `0` = smallest value                | `0` = around the average       |
| `1` = largest value                 | Positive = above average       |
| Very easy to understand             | Very commonly used in ML       |
You don’t need to memorize which one is “better.”
It depends on your dataset and the Machine Learning algorithm you are using.
Why Does Feature Scaling Actually Matter?
Here’s another way to think about it.
Imagine two pizzas.
One pizza’s size is recorded in meters:
0.3 mAnother person’s system records the same size in millimeters:
300 mmThe numbers are:
0.3
300
300 looks much bigger.
But that doesn’t mean the second pizza is 1,000 times bigger!
They are simply using different units.
The same kind of problem can happen with Machine Learning features.
One feature might naturally contain:
2, 3, 4, 5while another contains:
20,000, 40,000, 80,000Feature Scaling helps put them onto comparable numerical scales.
Which Algorithms Need Feature Scaling?
Feature Scaling is especially important for algorithms that care about distance or the size of numbers, such as:
- K-Nearest Neighbors (KNN)
- K-Means Clustering
- Support Vector Machines (SVM)
- Neural Networks
- Principal Component Analysis (PCA)
On the other hand, tree-based algorithms such as:
- Decision Trees
- Random Forests
usually don’t need Feature Scaling.
🧠 The Easiest Way to Remember Everything
Think of Feature Scaling like preparing people for a fair race.
Imagine one runner’s distance is recorded as:
5 kilometersand another runner’s distance is recorded as:
5,000 metersLooking only at the numbers:
5
vs
5000
They look completely different.
But they represent the same distance.
We need to put them on a comparable scale before making a fair comparison.
Machine Learning can have the same problem with features.
That’s why we use Feature Scaling.
Quick Summary
Feature Scaling makes different numerical features have comparable scales.
Remember:
Scaling is done column by column.
Large numbers don’t automatically mean a feature is more important.
Normalization usually puts values between
0and1.Standardization uses the mean and standard deviation.
Standard Deviation tells us how spread out values are around their average.
Algorithms like KNN, K-Means, SVM, PCA, and Neural Networks often benefit from scaling.
Decision Trees and Random Forests usually don’t require it.
And most importantly:
Feature Scaling changes the scale of your data — not what the data actually means.
Once you understand that sentence, you’ve understood the main idea behind Feature Scaling.