“THE FIRST MONTH THAT PROVED ME WRONG”
-ITF NECA-TSDP IN COLLABORATION WITH SHAMZBRIDGE CONSULT-

Going back some months. It all started with me just figuring out what’s next. Then one of my cousins told me about the opportunity. So, knowing I have an interest in upskilling, I took the bold step. Making that choice was the best choice at that moment, and I’m glad I did.
Fast forward to the present, already absorbed in the program. The Induction, my first real introduction to what the journey would look like.
We were introduced to the program’s structure, expectations, teamwork, projects, presentations, and the mindset we would need throughout the journey.
And, most importantly, we were actually expected to apply what we were learning. They were encouraging and eager to support us as we worked toward becoming better analysts.
Looking back, the induction was only the beginning, but it gave me an Idea of what was ahead. The first eye-opener to what I’m about to get myself into. On that day, we were briefed by the program’s manager, Aderoju Shamsudeen Adedapo (Mr Shamz), on the things that would be drilled into us. Hearing things like Excel, Power BI, SQL, Python, visualization, dashboards, and honestly, some of them sounded intimidating. They were sounding like the world would devour us. Then I said to myself
“If it didn’t kill the people before me, it’s not going to kill me; rather, it would make me stronger”
I was ready for what was to come.

I officially began my journey into data analysis, and it’s already been an exciting experience.
This whole journey will be a combination of physical classes, online sessions, hands-on practice, and collaborative learning. Knowing that gave me the assurance that I did right by my choice .Although it’s only the beginning, I’ve realized that data analysis is much more than working with numbers It’s about asking the right questions, solving problems, and making informed decisions using data.
One of the major tools we started learning with is Microsoft Excel, and now I understand why it’s considered one of the foundational tools for every aspiring data analyst.
Before this journey, I knew Excel as a spreadsheet tool. But I quickly started seeing it differently. Looking alien to me, but Iv’e come so far to be discouraged.
Le voyage commence (The journey begins)
The subsequent week after the induction was a walk in the park. As we were focused on the concepts of data analysis, the meaning of data cleaning, analysis, and visualization. We got to understand why data analysis is important.
At this point, I knew that I’m the one behind the steering what happens from here on out is my decision.
We were taught in Excel Essentials for Analysts, and it reinforced just how important Excel is in the world of data analysis. Some of the key areas we covered included:
•Why Excel remains an essential tool for data analysts.
•Understanding the Excel interface and how to navigate it efficiently.
•Learning useful keyboard shortcuts that improve speed and productivity.
Still on Excel, we got a good understanding of more advanced functions honestly, our coaches are the best. Even though they had their own thing doing, they still create time for us. Coach Bede Ozuluonye and Coach Damilola, thank you.
We then moved on to understanding the interface just like the way we were taught back then. On to knowing some functions that can be used.
I was introduced to several basic Excel functions and tools that make working with data much easier. Some of the concepts we’ve covered include:
- Understanding rows, columns, cells, and worksheets.
- Basic data entry and formatting techniques.
- Essential Excel functions such as SUM(), AVERAGE(), COUNT(), MIN(), MAX(), IF(), and COUNTIF().
- Sorting and filtering data to find useful information quickly.
- Working with tables to organize datasets more effectively.
- Introduction to cleaning messy data and preparing it for analysis.
- Keyboard shortcuts that improve speed and productivity.
While these may seem like simple concepts, I’ve learned that mastering the basics creates a strong foundation for more advanced analysis later on.


Peer Learning
One thing that stood out for me was the peer learning group we were all placed in. Like they say
“There’s strength in numbers”
There have been moments when I struggled with a concept, but listening to colleagues explain it from a different perspective made it easier to understand. We’ve shared ideas, solved problems together, asked questions without fear, and celebrated small wins. Shout out to us, Kings & Queens of “TEAM ROYAL”.
In my team were His Royal Majesty Ayuba, Taiwo, Samuel, Yusuf, and Her Royal Majesty Sarah and Hadizat, like we would jokingly call ourselves.
Aside from the fact that we had different teams, everyone was always rendering assistance when needed. I really appreciate it.

From Raw Data to Meaningful Insights: Learning to Clean, Analyze and Visualize Data
After getting introduced to Excel and some of its basic functions, I soon realized that knowing formulas was only the beginning.
The real question was:
“What do I actually do with all this data?”
That question led me into another important part of my data analytics journey — learning how to take raw, messy data and turn it into something meaningful. And honestly, this was where things started getting interesting.
First, I Had to Learn How to Clean the Mess
One thing I quickly discovered is that real-world data isn’t always as neat as we would like it to be.
Sometimes there are blank cells. Sometimes the same information is written in different ways. There can be duplicate records, inconsistent formats, spelling differences, and numbers that don’t behave like numbers.
Before I could analyze anything, I had to learn how to clean the data.
I started going through datasets column by column, identifying inconsistencies and correcting them. It taught me an important lesson:
Good analysis starts with good data.
There is no point creating beautiful charts or dashboards if the information you’re analyzing is inaccurate.
This part of the journey required patience. I wasn’t just clicking buttons in Excel anymore. I was beginning to understand why data preparation is such an important part of a data analyst’s job.


Once the data was cleaned, I wanted to understand what the numbers were actually saying.
This was where PivotTables came in.
At first, PivotTables seemed like another Excel feature I needed to learn. But the more I used them, the more I understood their value.
Then I realized that instead of scrolling through hundreds of rows trying to identify patterns manually, I could summarize the information in seconds.
Suddenly, the spreadsheet wasn’t just a collection of rows and columns. It was starting to tell a story.

Numbers alone don’t always communicate a message effectively.
This introduced me to another exciting part of the journey: data visualization.
I started turning the results from my analysis into charts.
A chart could make a trend that was difficult to notice in a table immediately obvious.
I began learning that choosing a chart isn’t just about making a spreadsheet look attractive. The chart should help answer a question.
What am I trying to show?
What comparison am I making?
What trend should the person looking at this notice?
That changed the way I looked at Excel. I wasn’t simply creating charts anymore. I was learning how to communicate with data.
My First Dashboard
And then came one of the parts I was most excited about: dashboard design. Being a creative person, this part eased the tension I was feeling before.
A dashboard brings everything together.
The cleaned data, the calculations, the PivotTables, the charts, the KPIs, and the insights.
Instead of having information scattered across different sheets, I could bring the most important findings together in one place.
This was also where I began thinking more about the person who would actually use the dashboard.
Would they understand what they’re seeing?
Can they quickly identify the most important numbers?
Does the visualization answer a question?
Can they interact with the data?
These questions made me realize that a good dashboard isn’t just about design. It’s about making information easier to understand and decisions easier to make.

professional development classes
Knowing all these skills and practically using them is not the end. We also need to develop other skills to fill in any loopholes we have, and that’s where professional development comes into play. This part is always taken by no other person than Aderoju Shamsudeen Adedapo (Mr Shamz).
His contribution on these days is always insightful.
These sessions allowed me to look beyond the technical side of data analytics and start thinking about the person behind the skills.
Our first Professional Development class focused on Team building.
We explored team-building strategies, the importance of team building, the value of being a team player, the features of an effective team, and how teams evolve over time.
At first, I thought team building was simply about learning how to work with other people.
But the session made me look at it differently.
In the professional world, you rarely work completely alone. As a data analyst, you may have to collaborate with managers, marketers, developers, financial teams, project teams, and other stakeholders.
You might be the person working with the data, but your ability to listen, communicate, contribute ideas, respect different perspectives, and work toward a common goal can be just as important as your technical skills. One of my biggest takeaways was that being a team player is more than simply being present in a group.
It means being willing to contribute, understanding your role while also supporting the goals of the team. And most importantly, it means understanding that a strong team can often achieve more than individuals working separately.
Get Temiloluwa Stephen’s stories in your inbox
Join Medium for free to get updates from this writer.
Our second Professional Development class took us in a completely different but equally important direction: Personal branding, and portfolio development.


This session made me ask myself a simple question
“If someone searches for me online, what will they see?”
That question hit differently.
Learning technological skills is one aspect of developing a career in data analytics. Another requirement is the ability to communicate those abilities and establish a professional identity around them.
We discussed the usefulness of branding, why personal branding matters, and how we can improve our online presence.
I began to understand that personal branding isn’t necessarily about all the paparazzi📸📸. It’s about becoming recognizable for the value you bring.
Another point of his was portfolio development. Before this session, I mainly thought of a portfolio as somewhere to display completed projects. Suddenly I’m starting to perceive it as something broader.
A portfolio should help tell the story of what I can do.
It should show:
- The problems I’ve worked on.
- The tools I’ve used.
- How I approached the problem.
- What I discovered.
- The insights I generated.
- And the value of those insights.
That means I’m not just collecting projects.
I’m building evidence of my growth.
MOMENT OF TRUTH (FIRST MINI CAPSTONE PROJECT)
Finally, the news we’ve all been waiting for. At that moment, I thought within me, “OMO”. Which can mean a lot of things, but that time it was me realizing that I’ll be doing what analysts do. It was a bittersweet feeling.
So when I opened the file for the dataset, I read through the instructions.
First, what is the whole project about? That was the question that popped up in my head.
The project is on Public Procurement & Government Spending in Nigeria.
We are being asked to act like a data analyst working for a civil-society transparency organisation. You have a dataset containing 540 government contract records from 2019–2023, covering Nigeria’s MDAs, sectors, states, and the FCT.
Our job is basically: Take the raw government contract data → clean it → analyse it → find problems/patterns → visualize your findings → build a dashboard → give recommendations.
The project was designed to test the Excel skills we’ve learned: cleaning, formulas, lookups, PivotTables, charts, and dashboards.
I then opened Excel and saw the dataset, but surprisingly it was looking back at me. I then said to myself.
“Fool me once, shame on you; fool me twice, shame on me.”

It was to be completed in a week, so throughout that week everything was blurry except the dataset😂. Still, in that week we were given other things too. Now adding other personal things. “The pressure increase the pressure decrease ”
I knew sleep was going to be taken from me, but I know it will come to an end. This feeling when you are at the war front, and you are strategically planning how you will attack your enemies. Just like one of My favourite quotes
“Know the enemy and know yourself, and in a hundred battles you will never be in peril.” Sun Tzu’s
That was the approach I used to solve every problem in each column. I was feeling like a warrior.
But some of my colleagues were not having it, being that is their first time. Call upon calls of which, everything was about how they would go about cleaning the dataset. It was all confusion
Honestly, I myself didn’t know how I would go about cleaning the dataset, but I will say with the help of our wonderful coaches, Bede Ozuluonye and Mrs Damilola Adeoye, and also “GOD DID”.
At the end, all efforts were not in vain, and we delivered.


Presentation phobia
After weeks of classes, practice, learning, and working on our projects, the day we had been preparing for had finally arrived — presentation day.
But before anyone could even begin presenting, there was one big question on everyone’s mind:
“Who is going first?”
At first, our coaches encouraged us to volunteer and pick ourselves to start. Surprisingly, the room became very quiet. Everyone suddenly became very interested in watching other people go first! 😂
The nervousness was real.
Since nobody seemed ready to take the first step, our coaches introduced a ballot system. We each picked a number, and that number determined the order in which we would present.
And just like that, the tension turned into excitement.
One after another, people got their turns to present their projects. Everyone had a different approach, different ideas, and different ways of telling the story behind their work. It was interesting to see how much everyone had learned and how differently we had applied the same skills we had been taught.
There were moments of nervousness, moments of confidence, and even moments of laughter. But with every presentation, I think the room became a little more relaxed.
Aderoju Shamsudeen Adedapo Mr (Shamz) also took time to review the presentations and provide feedback. Some slides were criticized where necessary, some corrections were pointed out, and some participants were asked to go back and make improvements to their projects based on the feedback they received.
And honestly, I think that was one of the most valuable parts of the presentation.
It wasn’t simply about standing in front of everyone and saying, “I’ve completed my project.”
It was also about being open to criticism, receiving feedback, identifying areas for improvement, and understanding that a project can always be made better.
Not everyone was able to present that day, so the presentations continued beyond that session. But for those who presented, it was an opportunity to step out of our comfort zones and put our learning into practice.
Looking back, what started with nervousness about who would present first eventually became a memorable and enjoyable experience.
It reminded me that sometimes, the hardest part is simply taking the first step.
And once you do, you realize:
“I was more prepared than I thought.”


The Dashboard

Then Came SQL: The Part of the Journey That Made Me Think Twice
After completing my Excel module and going through the project presentation, I thought I had a pretty good idea of what learning data analytics would look like.
And just like that, SQL came knocking on the door. Let’s say SQL came with a different energy.
I had heard about SQL before starting this programme, but knowing the name of a tool and actually sitting in front of a SQL interface and writing queries are two very different things.
This became the next chapter of my data analytics journey.
We started by understanding what SQL actually is and why it is important in data analytics. One of the things that stood out to me was that SQL isn’t just about writing random lines of code. It is a language that allows us to communicate with databases and retrieve, manipulate, and manage data.
We began with the foundations — understanding databases, tables, schemas, and how data is structured. We learned how to create a database and started understanding how different components within a database relate to one another. At first, some of these concepts felt abstract.
I remember thinking:
“Okay… I understand what you’re saying, but do I actually understand what I’m doing?”
Which is what led to us understanding it through practice.


One area we explored was database schemas. We looked at how data can be structured and organized within a database, including concepts such as logical schemas.
This was important because I began to understand that before you can effectively work with data, you need to understand how that data is organized. It reminded me of something I learned during my Excel journey:
“Before you analyze data, you need to understand the data”
In Excel, I was learning how to clean and organize columns. With SQL, I was beginning to understand how data is organized at the database level.
We started writing commands to create databases and tables. For example, we learned how commands such as CREATE and SELECT can be used to create the foundation for storing data. This was one of those moments where SQL started feeling more real.
I wasn’t just listening to someone explain databases anymore. I was actually creating one.
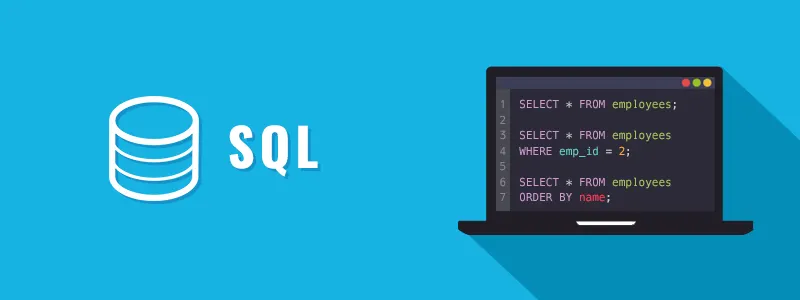
As the classes continued, we started working with different SQL commands and clauses. Explored how to retrieve and work with information stored in tables using commands such as SELECT and WHERE.
This simple query taught me something important: SQL allows you to ask very specific questions of your data.
Instead of manually searching through thousands of records, I can tell the database exactly what I’m looking for.
The Coding Challenges
I love that our SQL classes focus on hands-on learning instead of just handing us notes to read.
We’ve been made to write code.
We’ve had practical exercises and coding challenges where we were given problems and had to figure out the SQL query that would solve them. Sometimes I got the query right; sometimes I didn’t.
There were times I’d write a query that looked absolutely flawless to me, only for the SQL compiler to completely disagree. But every error became part of the learning process.
I started learning to look at an error message differently, not as “I failed”, but as “SQL is telling me where I need to look again.”