GOMView 2: Beyond Full-Stack Development — AI, GIS, 3D, and Engineering Interwoven


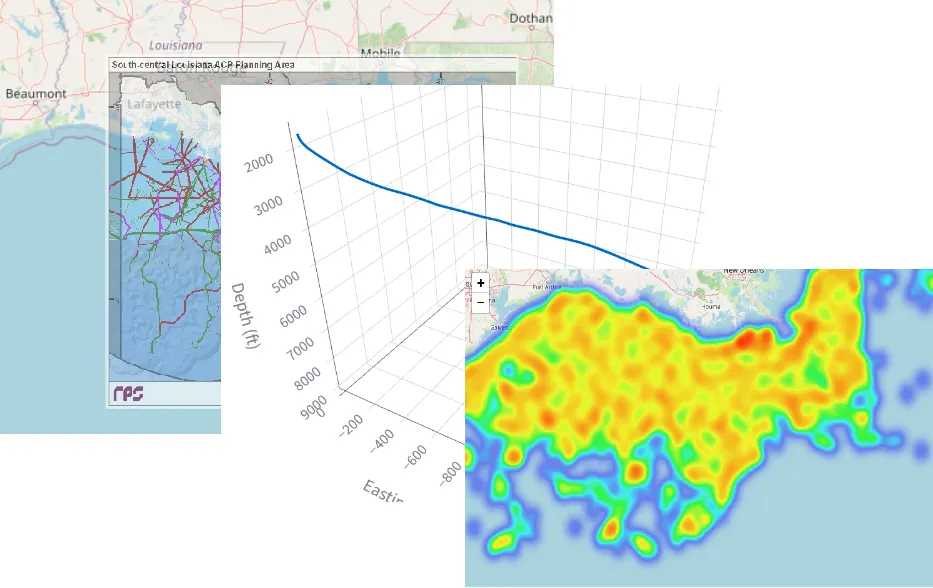
GOMView 2 is a modern platform for browsing and analyzing Gulf of Mexico subsurface E&P data. It is built on a modern cloud-native stack with GIS, 3D visualization, and domain-specific engineering calculations.
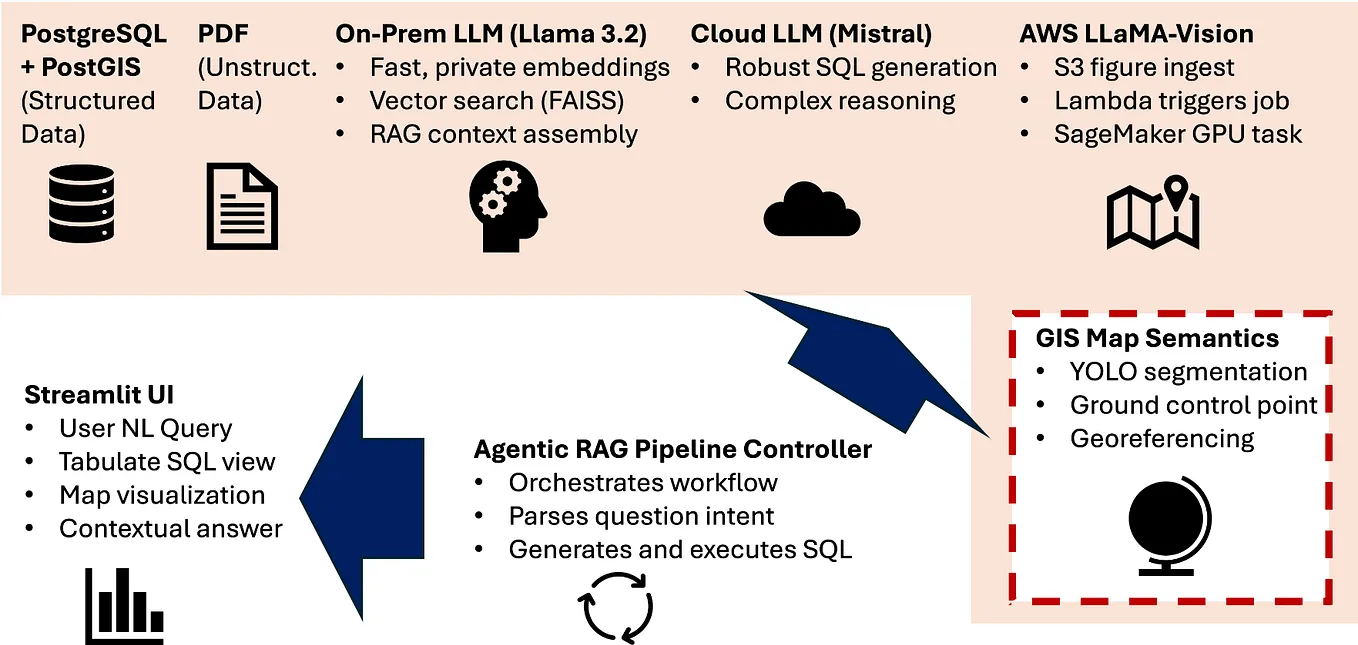
After two years in production, GOMView finally got a badly needed UX facelift! More importantly, Version 2 introduces an AI-in-the-loop experience, allowing users to query the BOEM Gulf of Mexico structured dataset using natural language.
The key features include:
- Immersive 3D well proximity scenes
- GIS browsing of 40,000+ wells across the Gulf of Mexico
- Natural-language data querying with AI
- Automatic decline-curve analysis (DCA)
Like many scientific applications, E&P software needs capabilities tailored to its domain. Geoscience is inherently spatial, making GIS a natural way to navigate a huge geographic area such as the Gulf of Mexico or West Texas.
But GIS is fundamentally 2½D. To truly experience a subsurface scene — especially the spatial relationship between nearby wells — we need true 3D.
Get David W’s stories in your inbox
Join Medium for free to get updates from this writer.
Data access has been another long-standing challenge in E&P. Over the past several decades, the industry has explored unified data models such as POSC Epicentre, unified APIs such as OpenSpirit, and search technologies such as Solr and Elasticsearch for unstructured data. I have written about some of these challenges and approaches in previous Medium articles.
The recent advances in AI open a new frontier: natural-language access to both structured and unstructured data. GOMView 2 brings that capability directly into the application.
On the engineering side, hyperbolic decline-curve analysis has long been a popular method for forecasting near-term production. GOMView 2 makes DCA automatic.
The challenge is that a well’s production history rarely starts with a clean decline at time zero. Production can ramp up, fluctuate, shut in, and go through several cycles before settling into a meaningful decline.
GOMView therefore uses an algorithm to identify the latest production cycle and automatically select it for decline-curve analysis.
Now, let’s look at a simple high-level workflow. Suppose we want to identify the top 30 most productive deep water wells in the Gulf of Mexico, inspect one of them in the context of its neighboring wells in 3D, explore its well information, and finally perform decline-curve analysis on its historical production data.
The entire workflow — from finding the wells, to exploring them in GIS and 3D, to retrieving well information, to performing engineering analysis — is shown below in four steps.


GOMView 2 is an experiment in bringing AI, GIS, 3D visualization, and engineering data science together in one interactive experience. The goal is simple: make the increasingly complex world of E&P data feel a little more natural to explore.