DATA VISUALIZATION

What is Data Visualization?
Data Visualization is the graphical representation of data using visual elements such as charts, graphs, maps, and dashboards. It helps transform complex datasets into easy-to-understand visuals, enabling users to identify patterns, trends, relationships, and insights quickly.
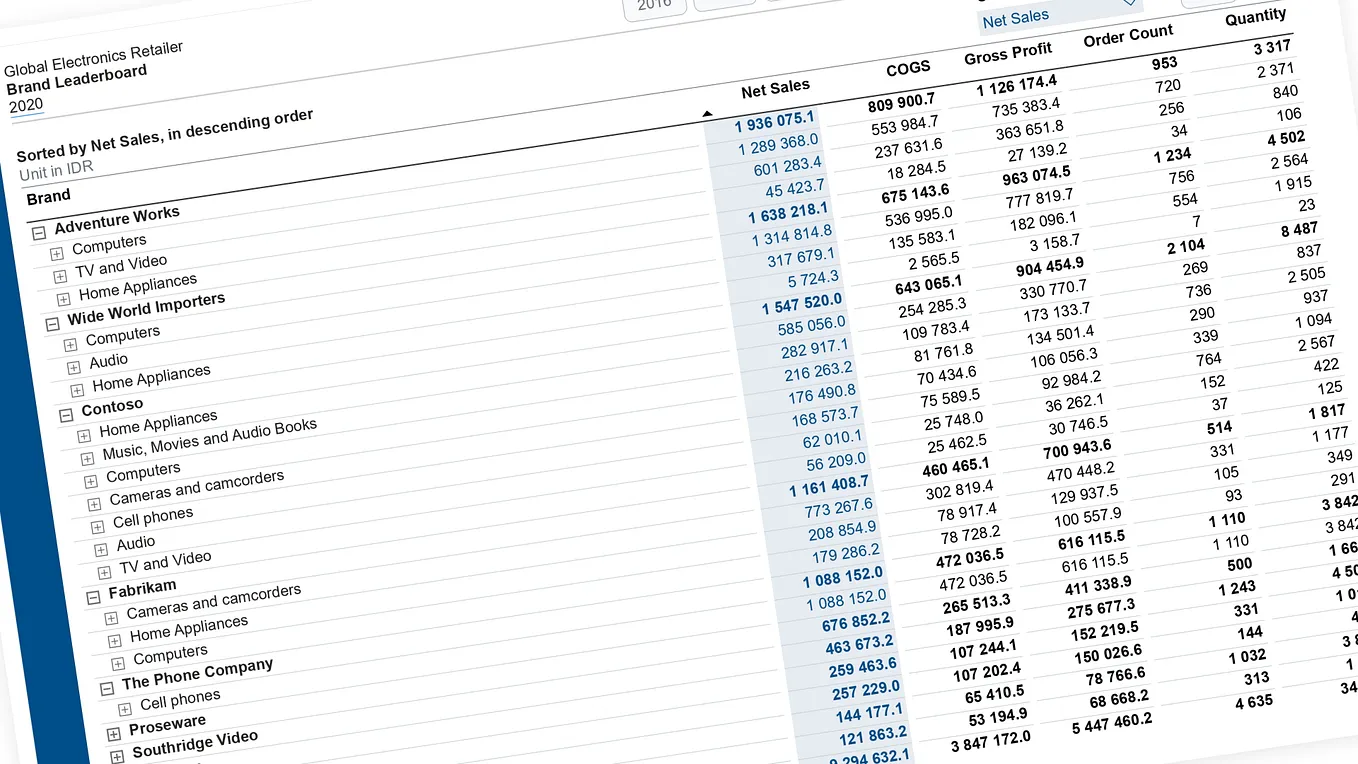
Instead of analyzing thousands of rows in a spreadsheet, visualization allows decision-makers to understand data at a glance, making it an essential part of modern Business Intelligence (BI), Data Analytics, and Artificial Intelligence.
Why is Data Visualization Important?
Organizations generate massive amounts of data every day. Without visualization, understanding this data becomes time-consuming and difficult.
Data visualization helps organizations:
- Identify trends and patterns
- Compare business performance
- Detect outliers and anomalies
- Support faster decision-making
- Improve communication of insights
- Monitor Key Performance Indicators (KPIs)
- Simplify complex datasets
- Enhance storytelling with data
Example:
A retail company can quickly identify its best-selling products and seasonal sales trends through a dashboard instead of manually reviewing thousands of sales records.
Advantages of Data Visualization
- Makes complex information easy to understand.
- Helps identify trends and hidden patterns.
- Improves decision-making with visual insights.
- Saves time when analyzing large datasets.
- Makes reports more engaging and interactive.
- Detects anomalies and unusual data points quickly.
- Improves communication between technical and non-technical teams.
- Supports real-time monitoring through dashboards.
- Enhances business forecasting and planning.
Disadvantages of Data Visualization
- Poor chart selection can mislead users.
- Overloaded dashboards create confusion.
- Requires clean and accurate data.
- Complex visualizations may be difficult for beginners to interpret.
- Advanced tools such as Power BI or Tableau require training.
- Large datasets may affect dashboard performance.
Limitations of Data Visualization
Although visualization is powerful, it has some limitations:
- It cannot replace proper data analysis.
- Incorrect visualizations may lead to incorrect conclusions.
- Visualizations depend heavily on data quality.
- Too much information on one dashboard reduces readability.
- Human interpretation is still required for making business decisions.
Types of Data Visualization
1. Static Visualization
Displays fixed charts and graphs that do not change.
Example: Reports in PDF or printed documents.
2. Interactive Visualization
Allows users to filter, drill down, and explore data.
Example: Power BI and Tableau dashboards.
3. Real-Time Visualization
Updates automatically as new data becomes available.
Example: Stock market dashboards or website traffic monitoring.
4. Geographic Visualization
Represents data on maps.
Example: Sales by state or country.
5. Infographics
Combines visuals, icons, and text to communicate information effectively.
Why Use Graphs?
Graphs make data easier to interpret than tables because the human brain processes visual information faster than numerical data.
Graphs help users:
- Compare values
- Understand trends
- Identify relationships
- Detect outliers
- Present information professionally
- Support business decisions
Common Types of Graphs
1. Bar Chart

Meaning:
Compares values across different categories.
Best Used For:
- Sales by product
- Revenue by region
- Employee performance
Advantages:
- Easy to understand
- Excellent for comparisons
- Suitable for categorical data
2. Line Chart

Meaning:
Shows changes or trends over time.
Best Used For:
- Monthly sales
- Website traffic
- Stock prices
Advantages:
- Displays trends clearly
- Helps forecast future performance
3. Pie Chart

Meaning:
Shows how different categories contribute to a whole.
Get Vansh Arora’s stories in your inbox
Join Medium for free to get updates from this writer.
Best Used For:
- Market share
- Budget allocation
- Product contribution
Advantages:
- Easy to understand proportions
- Effective with a small number of categories
4. Scatter Plot

Meaning:
Shows the relationship between two numerical variables.
Best Used For:
- Advertising spend vs. sales
- Height vs. weight
Advantages:
- Identifies correlations
- Detects outliers
5. Histogram

Meaning:
Displays the frequency distribution of numerical data.
Best Used For:
- Age distribution
- Salary distribution
- Exam scores
Advantages:
- Shows data distribution
- Helps identify skewness and patterns
6. Box Plot

Meaning:
Displays the spread of data and highlights outliers.
Best Used For:
- Salary analysis
- Performance comparison
Advantages:
- Detects outliers
7. Heatmap

Meaning:
Uses colors to represent data intensity or relationships.
Best Used For:
- Correlation analysis
- Website click tracking
- Customer behavior
Advantages:
- Easy to identify patterns
- Excellent for large datasets
8. Treemap

Meaning:
Represents hierarchical data using nested rectangles.
Best Used For:
- Sales by product category
- Budget allocation
Advantages:
- Saves space
Visualizes hierarchical relationships
Popular Data Visualization Tools
- Microsoft Excel — Basic charts and quick reporting.
- Power BI — Interactive dashboards and business intelligence.
- Tableau — Advanced data visualization and storytelling.
- Google Looker Studio — Cloud-based dashboards and reporting.
- Matplotlib & Plotly (Python) — Custom and interactive visualizations for data science.
Real-World Applications
- Healthcare: Patient monitoring, disease tracking, hospital performance.
- Finance: Fraud detection, investment analysis, financial reporting.
- Retail: Sales analysis, inventory management, customer segmentation.
- Marketing: Campaign performance, conversion rates, customer acquisition.
- Manufacturing: Production monitoring, quality control, predictive maintenance.
Stop Looking at Spreadsheets: How Data Visualization Helps You See What Really Matters
*The best business decisions aren’t made by people with the most data. They’re made by people who understand their data the fastest.*
Last year, I helped a friend who owns a small coffee shop understand why his profits had suddenly dropped. His first instinct was to blame rising coffee bean prices. His manager believed fewer customers were visiting the shop. The cashier was convinced that a newly opened café nearby had taken away many of their regular customers. Then he showed me his sales data.
It was an Excel file containing nearly **25,000 transactions** collected over six months. Every latte, cappuccino, sandwich, payment method, and customer visit was neatly recorded in rows and columns. The information was there but answers weren’t.
After spending just a few minutes cleaning the data and creating a simple visualization, something unexpected emerged.
Ø It wasn’t rising costs.
Ø It wasn’t new competition.
Ø The problem was much simpler.
Weekend sales were booming, but weekday afternoon sales had been quietly declining for months. The coffee shop had enough staff during slow hours but not enough during peak hours, leading to longer wait times, abandoned orders, and unhappy customers.
One chart revealed what thousands of spreadsheet rows couldn’t.
That moment perfectly captures why **data visualization** has become one of the most valuable skills in analytics. It doesn’t create new information rather it helps us understand the information we already have.
We Don’t Have a Data Problem. We Have an Interpretation Problem.
Businesses love collecting data. Every click on an e-commerce website, every swipe of a credit card, every hospital appointment, every online order, and every customer review becomes another data point stored in a database. The challenge is no longer collecting data.
The real challenge is answering questions such as:
o Why are sales falling?
o Which products are truly profitable?
o Which customers are likely to leave?
o Where are we losing money?
Without visualization, answering these questions often requires hours of digging through spreadsheets. With visualization, many of the answers become obvious within seconds.
Coffee shop owner begin asking far more valuable questions:
o Should we schedule more employees on weekends?
o Why is Monday consistently underperforming?
o Would a weekday discount increase foot traffic?
o Should we introduce a breakfast combo before office hours?
ØWhy Our Brains Prefer Pictures Over Numbers
There’s a reason dashboards have become the standard in boardrooms around the world.
Our brains are remarkably efficient at recognizing patterns. Imagine two scenarios.
In the first, someone hands you a spreadsheet containing 50,000 sales records. In the second, they show you a clean dashboard highlighting revenue trends, top-selling products, customer segments, and regional performance . Which one would help you understand the business faster?
The answer is obvious.
Humans evolved to recognize shapes, movement, and patterns long before they learned mathematics. That’s why a sudden spike in a line chart immediately grabs our attention, while the same change buried in a spreadsheet often goes unnoticed.
Visualization reduces mental effort instead of spending time searching for information, we spend our energy understanding it that shift from searching to understanding is what makes data visualization so powerful.
Conclusion
Data visualization is a vital component of modern data analytics because it transforms raw data into meaningful insights that support informed decision-making. By using appropriate charts, graphs, and dashboards, organizations can identify trends, monitor performance, detect anomalies, and communicate findings effectively. As businesses continue to rely on data-driven strategies, mastering data visualization has become an essential skill for data analysts, business intelligence professionals, and decision-makers alike.