ML Data Visualizations

Import using below commands all the relevant visualization libraries.
import seaborn as sns
import matplotlib.pyplot as plt
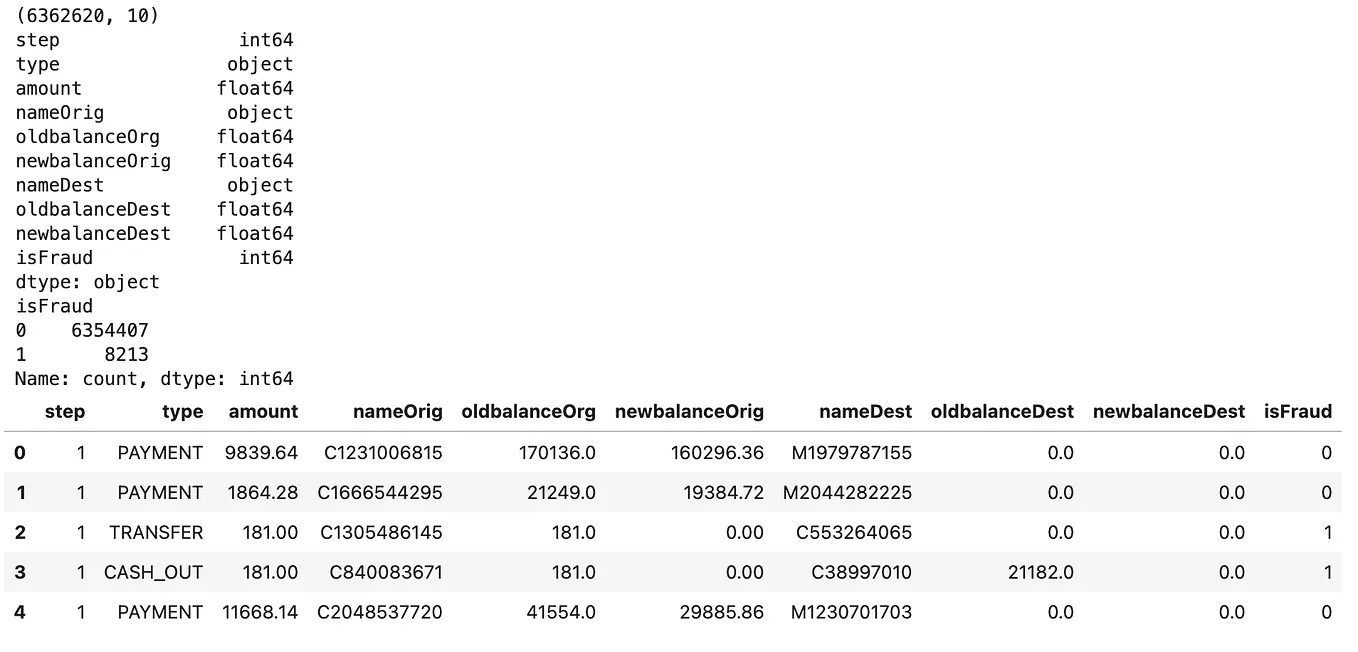
You find below the code as well as the outcome visualization. Dataset is briefly mentioned in the comments. The purpose of this blog is to give an idea of visualization commands and possiblities. Details on the underlying dataset and ML algorithm applied are published as separate blogs.
Get Vinodh Kumar S’s stories in your inbox
Join Medium for free to get updates from this writer.
Countplot
sns.countplot(x='type', data = data)

# Here, type is a column in the data.
# Dataset: online fraud detection;
Bar plot
sns.barplot(x='type', y='amount', data = data)
Distribution Plot
sns.displot(data['step'], bins=50)
Heatmap
sns.heatmap(data.apply(lambda x: pd.factorize(x)[0]).corr(),
   cmap='BrBG',
   fmt='.2f',
   linewidths=2,
   annot=True)
pd.factorize(x)[0] converts categorical (object/string) columns into numeric codes — because correlation (.corr()) only works on numbers.
Without this, data.corr() would just ignore all non-numeric columns.
pd.factorize() actually returns two things — a tuple with the codes and unique original values, we only take the codes. Hence, the [0].