Monitoring z/VM Hypervisor Utilization with Instana’s OpenTelemetry Collector

Authors: Rajesh K. Jeyapaul, Neha Ghongade, Ying Mo, Jinsong Wang
Introduction: The z/VM Monitoring Challenge
In enterprise environments running IBM Z systems, z/VM hypervisors form the critical foundation of your virtualized infrastructure. Yet monitoring these hypervisors presents unique challenges:
- Visibility Gap: Traditional APM tools don’t natively support z/VM metrics.
- Resource Overcommitment: Without hypervisor-level monitoring, you can’t detect when LPARs are overcommitted, leading to performance degradation.
- Capacity Planning Blindness: Lack of visibility into actual hypervisor utilization makes capacity planning guesswork.
- Root Cause Analysis Delays: When applications slow down, you can’t correlate performance issues with underlying hypervisor resource constraints
- Siloed Monitoring: Hypervisor metrics live separately from application observability data
Tools like hyptop provide z/VM resource utilization visibility, but how do you integrate this data into your modern observability platform? How do you correlate hypervisor metrics with application performance in real-time?
This is where the Instana Distribution of OpenTelemetry Collector (IDOT) Shell Receiver changes the game.
The Solution: IDOT Shell Receiver
The IDOT Shell Receiver is a powerful component that executes shell commands and transforms their output into OpenTelemetry metrics and logs. Think of it as a universal adapter that bridges the gap between legacy system tools and modern observability platforms.
IDOT brings a streamlined OpenTelemetry experience to the Instana ecosystem, making it easy to collect telemetry from any source — including command-line tools, legacy systems, and custom scripts — while maintaining full OpenTelemetry compatibility.
Key Capabilities
- ✅ Execute any shell command and capture its output
- ✅ Parse structured and unstructured data using automatic or regex-based parsing
- ✅ Transform to OpenTelemetry format (metrics, logs, or both)
- ✅ Send to Instana via optimized OTLP exporters
- ✅ Schedule collection at configurable intervals
- ✅ Full OpenTelemetry compatibility for vendor-neutral observability
Example: Monitoring z/VM with hyptop
receivers:
  shell:
    collection_interval: 60s
    commands:
      - name: zvm_hypervisor_metrics
        command: hyptop -b -n 1 | awk '$2 ~ /^[0-9]+$/ {print $1, $2, $3, $5}'
        metric_name: system.hypervisor
        description: "z/VM Hypervisor CPU and Memory metrics"
        output_type: metric
        row_regex: '^\s*(\S+)\s+(\d+)\s+([\d.]+)\s+([\d.]+)\s*$'
        metric_names: [system, cpucount, cpu_percent, memory_gb]
        field_types: [Attribute, Gauge, Gauge, Gauge]
        labels:
          source: "hyptop"
          level: "hypervisor"
          platform: "zvm"

exporters:
  otlp:
    endpoint: "<instana-backend-subdomain>:443"
    headers:
      x-instana-key: "${INSTANA_AGENT_KEY}"

service:
  pipelines:
    metrics:
      receivers: [shell]
      exporters: [otlp]
We recommend configuring the OTLP endpoint using a subdomain on port 443, for example, otlp-grpc-blue-saas.instana.io:443. For full configuration details, refer to the official documentation: OTLP Endpoint Configuration Guide.
That’s it! You’re now monitoring z/VM hypervisor resource (CPU and Memory) utilization metrics in Instana alongside your application telemetry.
How It Works: Architecture

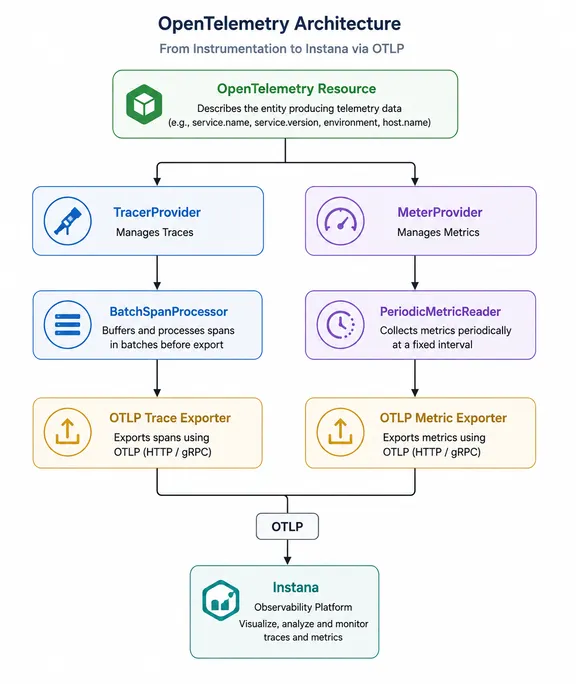
The flow:
- Command Execution: IDOT Shell Receiver executes hyptop (or any shell command) at configured intervals.
- Output Capture: Raw command output is captured in real-time
- Parsing: Output is parsed using automatic detection or regex patterns
- Transformation: Parsed data is converted to OpenTelemetry metrics with proper types and labels
- Export: Metrics are sent to Instana Server (backend) via OTLP protocol
- Visualization: Metrics appear in Instana UI with full context and correlation
Use Cases
Scenario 1: CPU Utilization at z/VM Hypervisor
The Problem: A financial services company running critical workloads on z/VM noticed intermittent application slowdowns but couldn’t identify the root cause.
Sample hyptop Output:
system       cpucount   cpu%     memoryinGB
A3E10008     8          92.5     14
B7X22014     12         87.3     72
C9Z15020     16         15.2     128
D4M18032     8          95.8     32
Generated Metrics in Instana:
- system.hypervisor.cpu_percent{system="A3E10008", platform="zvm"} = 92.5 - system.hypervisor.cpu_percent{system="D4M18032", platform="zvm"} = 95.8 - system.hypervisor.memory_gb{system="A3E10008", platform="zvm"} = 14 Alert Triggered in Instana:
⚠️ CPU Overcommitment Detected
System: A3E10008, D4M18032
Current: 92.5%, 95.8% | Threshold: 90%
Impact: 5 applications affected
Recommendation: Redistribute workload or add capacity
Outcome: MTTR was reduced, capacity planning improved (preventing future incidents), and overall resource allocation was optimized.
Scenario 2: Capacity Planning and Optimization
The Challenge: Understanding actual vs. allocated resources across LPARs.
Configuration:
- name: zvm_capacity_metrics
  command: |
    hyptop -b -n 1 | awk 'NR>1 {
      printf "%s,%s,%s,%s,%s\n", $1, $2, $3, $4, $5
    }'
  metric_name: system.hypervisor.capacity
  row_regex: '^(\S+),(\d+),([\d.]+),([\d.]+),([\d.]+)$'
  metric_names: [system, cpucount, cpu_percent, memory_gb, memory_percent]
  field_types: [Attribute, Gauge, Gauge, Gauge, Gauge]
Insights Gained: — System C9Z15020 running at only 15.2% CPU utilization — Identified opportunity to consolidate workloads — Freed up 2 LPARs for new projects
Installing IDOT Shell Receiver on z/Linux
To install IDOT Shell Receiver on z/Linux, follow this procedure.
Prerequisites
- z/Linux system
- Access to z/VM hypervisor (for hyptop command)
- Network connectivity to Instana backend
- Instana agent key
Binary Installation (Recommended for z/Linux)
# Download IDOT for s390x architecture
curl -Lo instana_otelcol_setup.sh https://github.com/instana/instana-otel-collector/releases/latest/download/instana-otel-collector-installer-latest-linux-s390x.sh
# Make it executable
chmod +x instana_otelcol_setup.sh
Installing IDOT Shell Receiver on other platforms
For other operating systems and architectures (Linux: x86–64 (amd64), s390x (IBM Z)), see the IDOT GitHub repository for platform-specific installation instructions and binaries.
Configuration
Basic Configuration Structure
Update /opt/instana/collector/config/config.yaml :
receivers:
  shell:
    collection_interval: 60s  # Collect every 60 seconds
    timeout: 30s              # Command timeout
    commands:
      - name: command_identifier
        command: your-shell-command
        metric_name: your.metric.name
        description: "Metric description"
        output_type: metric     # or "log" or "both"
        # Parsing configuration (see below)

exporters:
  otlp:
    endpoint: " <instana-backend-subdomain>:443"
    headers:
      x-instana-key: "${INSTANA_AGENT_KEY}"
    tls:
      insecure: false  # Set to true for testing only

  # Optional: Debug exporter for troubleshooting
  debug:
    verbosity: detailed
    sampling_initial: 5
    sampling_thereafter: 200

service:
  pipelines:
    metrics:
      receivers: [shell]
      exporters: [otlp]

    # Optional: Separate pipeline for logs
    logs:
      receivers: [shell]
      exporters: [otlp]
Complete z/VM Hypervisor Monitoring Configuration
receivers:
  shell:
    collection_interval: 60s
    timeout: 30s
    commands:
      # Main hypervisor metrics
      - name: zvm_hypervisor_metrics
        command: hyptop -b -n 1 | awk '$2 ~ /^[0-9]+$/ {print $1, $2, $3, $5}'
        metric_name: system.hypervisor
        description: "z/VM Hypervisor CPU and Memory metrics"
        output_type: metric
        row_regex: '^\s*(\S+)\s+(\d+)\s+([\d.]+)\s+([\d.]+)\s*$'
        metric_names: [system, cpucount, cpu_percent, memory_gb]
        field_types: [Attribute, Gauge, Gauge, Gauge]
        labels:
          source: "hyptop"
          level: "hypervisor"
          platform: "zvm"

      # Disk I/O metrics
      - name: zvm_disk_io
        command: iostat -x 1 2 | tail -n +4 | awk 'NF==14 {print $1, $4, $5, $6}'
        metric_name: system.disk.io
        description: "Disk I/O statistics"
        output_type: metric
        row_regex: '^\s*(\S+)\s+([\d.]+)\s+([\d.]+)\s+([\d.]+)\s*$'
        metric_names: [device, read_kb_per_sec, write_kb_per_sec, util_percent]
        field_types: [Attribute, Gauge, Gauge, Gauge]
        labels:
          source: "iostat"
          platform: "zvm"

      # Network statistics
      - name: zvm_network_stats
        command: cat /proc/net/dev | tail -n +3 | awk '{print $1, $2, $10}'
        metric_name: system.network.io
        description: "Network interface statistics"
        output_type: metric
        row_regex: '^\s*(\S+):\s+(\d+)\s+(\d+)\s*$'
        metric_names: [interface, bytes_received, bytes_transmitted]
        field_types: [Attribute, Gauge, Gauge]
        labels:
          source: "proc"
          platform: "zvm"

exporters:
  otlp:
    endpoint: "<instana-backend-subdomain>:443"
    headers:
      x-instana-key: "${INSTANA_AGENT_KEY}"
    compression: gzip
    timeout: 10s
    retry_on_failure:
      enabled: true
      initial_interval: 5s
      max_interval: 30s
      max_elapsed_time: 300s

service:
  pipelines:
    metrics:
      receivers: [shell, otlp]
      exporters: [otlp]

  telemetry:
    logs:
      level: info
      output_paths:
        - /var/log/idot/collector.log
    metrics:
      level: detailed
      address: localhost:8888
When to Use Automatic vs Regex-Based Parsing Configuration
Instana’s Otel Collector supports both automatic numeric parsing and regex-based structured parsing.
Use automatic parsing for simple numeric outputs, and regex parsing when you need structured field extraction and type control.
Automatic Parsing
Best for simple numeric outputs:
- name: cpu_temperature
  command: cat /sys/class/thermal/thermal_zone0/temp
  metric_name: system.cpu.temperature
  output_type: metric
  # No regex needed - automatically parsed as number
Regex-Based Parsing
Get Neha Ghongade’s stories in your inbox
Join Medium for free to get updates from this writer.
Best for complex, structured output where you need control over field types:
- name: process_metrics
  command: ps aux | grep myapp | awk '{print $2, $3, $4, $11}'
  metric_name: process.resources
  output_type: metric
  row_regex: '^\s*(\d+)\s+([\d.]+)\s+([\d.]+)\s+(\S+)\s*$'
  metric_names: [pid, cpu_percent, mem_percent, command]
  field_types: [Attribute, Gauge, Gauge, Attribute]
  # pid and command are Attributes (labels), not metrics
Key Difference: Regex parsing lets you mark fields like PIDs, system names, or identifiers as Attribute instead of Gauge, preventing meaningless metric aggregations.
Multi-Line Parsing
For commands that output multiple related metrics:
- name: system_overview
  command: |
    echo "cpu_usage $(top -bn1 | grep 'Cpu(s)' | awk '{print $2}' | cut -d'%' -f1)"
    echo "memory_used $(free -m | awk 'NR==2{print $3}')"
    echo "disk_used $(df -h / | awk 'NR==2{print $5}' | cut -d'%' -f1)"
  metric_name: system.overview
  output_type: metric
  row_regex: '^(\S+)\s+([\d.]+)$'
  metric_names: [metric_type, value]
  field_types: [Attribute, Gauge]
Performance Optimization
receivers:
  shell:
    # Balance freshness vs. system load
    collection_interval: 60s  # Adjust based on metric volatility

    commands:
      - name: optimized_command
        # Limit output to reduce parsing overhead
        command: top -bn1 | head -20

        # Set reasonable timeout
        timeout: 5s

        # Use efficient parsing
        row_regex: '^(\S+)\s+(\d+)$'  # Simple regex is faster
Performance Tips
— Use a collection_interval appropriate for metric volatility (ror example, 60 seconds for stable metrics, 10s for highly volatile metrics)
— Limit command output with head, tail, or awk
— Use efficient regex patterns (avoid unnecessary backtracking)
— Monitor IDOT resource usage through /metrics endpoint
— Consider batching related metrics in single commands
Naming Conventions
Follow OpenTelemetry semantic conventions:
# ✅ Good: Hierarchical, descriptive, follows conventions
metric_name: system.cpu.utilization
metric_name: system.disk.io.operations
metric_name: system.network.io.bytes

# ❌ Avoid: Flat, ambiguous, non-standard
metric_name: cpu
metric_name: disk_ops
metric_name: net
Viewing Metrics in Instana
Infrastructure View
Once IDOT is collecting metrics, they appear in Instana’s Infrastructure view:
- Navigate to Infrastructure → Analyze Infrastructure


2. Search for OTEL Host: in Entities and Select your host


3. View metric details: On the OTEL host, click on the entity listing under Open Telemetry as shown in the below screenshot


4. Create a Custom dashboard:

To create a custom dashboard, see building custom dashboard.
To Create This Dashboard:
1. Go to Dashboards → Create New Dashboard
2. Add widgets: — Select Table
- Data source: Infrastructure and Platforms
- Entity Type: Open telemetry
- Datasets:
- Metric -> Other->metrics.gauges.shellreceiver/system.metrics.shell.hypervisor.cpuutilization
- Table Configuration: metric.tag.system
Refer below screenshots for the same (Follow same to add more columns like CPU count, etc.)

Refer this building custom dashboard to create a custom dashboard.
Creating Alerts and Events
Custom Event creation: Step by step:
- Navigate to Settings -> Events -> New Event
- Define Event Details
- Condition: Source -> Custom metrics
- Entity Type -> Open telemetry SDK
- Metric -> Metrics.gauges.shellreceiver/hypervisor.cpuusagemodified{metric_type=”cpu%”,system=”a93hcit1"}
- Provide Aggregation type like min/Avg/Max and value, operator (>,<,>= or <=, etc..) rest of the things
- Create Event
Alert Configuration on Instana UI: Step-by-step:
- Go to Settings → Alerts → Create Alert.
- Define Alert Scope:
- Name: “z/VM CPU Overcommitment”
- Description: “Alert when hypervisor CPU exceeds threshold”
3. Events -> Select Alerts on Events.
4. Add Event -> Select the custom event created in previous step.
5. Test Alerting:
- Add Alert Channel (Email/Slack/Pager Duty, etc…)
6. Create Alert
7. After the desired condition is met, you’ll receive a notification on the configured alert channel. click on view event it’ll navigate you to that event.


To know more, see https://www.ibm.com/docs/en/instanaobservability/current?topic=instana-managing-events-alerts
Conclusion
The IDOT Shell Receiver transforms how you monitor resource utilization at the z/VM hypervisor level, bringing them into your modern observability stack with minimal effort. By bridging the gap between traditional command-line tools and OpenTelemetry-based observability.
Ready to transform your z/VM monitoring? Try Instana free and deploy IDOT today.
Note: Although this article demonstrates the shell receiver in the context of IBM Z, the shell receiver is platform neutral. It can be used on any supported platform where custom data collection is required. The configuration syntax and usage remain the same across environments.
For questions that are not included in this section, contact IBM Support.