InData Storytelling CornerbyJohn Loewen, PhD·14h agoHow To Map Ocean Plastic By Country: Shocking Results With PythonA step by step Python tutorial on visualizing ocean waste
Data4v·16h agoSave the Burning of Lanka for the Appendix: A Ramayana Lesson for Data ScientistsImagine surviving a celestial weapon, defeating five generals, and setting an enemy capital ablaze — and leaving all of it out of your…
Omkar Badadale·1d agoI Tried to Predict ER Wait Times. Last Year’s Number Beat My ML Model.Seven years of CMS hospital data, 2,501 pairs of nearby ERs, and the model I couldn’t make beat a single number.
InData Storytelling CornerbyJohn Loewen, PhD·1d agoIts The Chart That Changed Energy History: Why Nobody In the World CaresA Python title generation tutorial with renewable energy dataA response icon1A response icon1
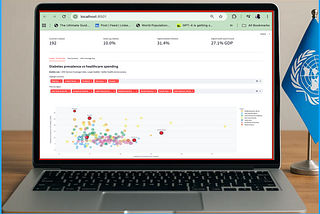
InData Storytelling CornerbyJohn Loewen, PhD·2d agoHow To With Streamlit: Correlating Hidden Statistics on World DiabetesA Python Streamlit tutorial exploring global health statisticsA response icon1A response icon1
Gomolemo Chipane·4d agoThe Problem with Measuring Engagement Without Understanding ItJournalism, Digital Media and Analytics | FridayA response icon1A response icon1
InData Storytelling CornerbyJohn Loewen, PhD·4d agoThe Slope Chart Principle: How To Reveal Surprising Stats On 25 Years Of World UrbanizationA Python tutorial using World Bank urban population dataA response icon1A response icon1
InarconsisbyAna Milutinovic·5d agoA week in Superset, a day in MotherDuck DivesI recently built the same kind of dashboard twice, once as custom Apache Superset plugins and once as a MotherDuck Dive. This article…
InData Storytelling CornerbyJohn Loewen, PhD·5d agoHow To Use Cairo’s Truthful Principle On The Hidden Water DivideA Python tutorial using the UN SDG water datasetA response icon1A response icon1
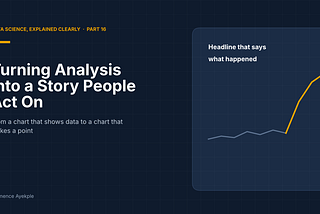
Clemence Ayekple·6d agoTurning Analysis Into a Story People Act OnFrom a chart that shows data to a chart that makes a point