
Abstract
Background: Ecological momentary assessment (EMA) offers an effective method to collect frequent, real-time data on an individual’s well-being. However, challenges exist in response consistency, completeness, and accuracy.
Objective: This study examines EMA response patterns and their relationship with sensed behavior for data collected from diverse studies. We hypothesize that EMA response rate (RR) will vary with prompt time of day, number of questions, and behavior context. In addition, we postulate that response quality will decrease over the study duration and that relationships will exist between EMA responses, participant demographics, behavior context, and study purpose.
Methods: Data from 454 participants in 9 clinical studies were analyzed, comprising 146,753 EMA mobile prompts over study durations ranging from 2 weeks to 16 months. Concurrently, sensor data were collected using smartwatch or smart home sensors. Digital markers, such as activity level, time spent at home, and proximity to activity transitions (change points), were extracted to provide context for the EMA responses. All studies used the same data collection software and EMA interface but varied in participant groups, study length, and the number of EMA questions and tasks. We analyzed RR, completeness, quality, alignment with sensor-observed behavior, impact of study design, and ability to model the series of responses.
Results: The average RR was 79.95%. Of those prompts that received a response, the proportion of fully completed response and task sessions was 88.37%. Participants were most responsive in the evening (82.31%) and on weekdays (80.43%), although results varied by study demographics. While overall RRs were similar for weekday and weekend prompts, older adults were more responsive during the week (an increase of 0.27), whereas younger adults responded less during the week (a decrease of 3.25). RR was negatively correlated with the number of EMA questions (r=−0.433, P<.001). Additional correlations were observed between RR and sensor-detected activity level (r=0.045, P<.001), time spent at home (r=0.174, P<.001), and proximity to change points (r=0.124, P<.001). Response quality showed a decline over time, with careless responses increasing by 0.022 (P<.001) and response variance decreasing by 0.363 (P<.001). The within-study dynamic time warping distance between response sequences averaged 14.141 (SD 11.957), compared with the 33.246 (SD 4.971) between-study average distance. ARIMA (Autoregressive Integrated Moving Average) models fit the aggregated time series with high log-likelihood values, indicating strong model fit with low complexity.
Conclusions: EMA response patterns are significantly influenced by participant demographics and study parameters. Tailoring EMA prompt strategies to specific participant characteristics can improve RRs and quality. Findings from this analysis suggest that timing EMA prompts close to detected activity transitions and minimizing the duration of EMA interactions may improve RR. Similarly, strategies such as gamification may be introduced to maintain participant engagement and retain response variance.
doi:10.2196/57018
Keywords
Introduction
Background
Ecological momentary assessment (EMA), also known as experience sampling or in situ (situated) self-reporting, is a powerful method for capturing real-time insights into an individual’s health and well-being. Leveraging the convenience and ubiquity of mobile devices, EMA has been particularly effective in longitudinally monitoring conditions such as depression and mental well-being [,], mobility [], physical activity [], and fatigue [].
The strength of EMA lies in its ability to minimize recall bias [,] and provide more fine-grained longitudinal data compared with traditional observation methods or retrospective reporting [,]. Participants can answer questions without traveling to a research lab, reducing a burden that is already great for individuals with Alzheimer disease and related dementias. Data collected through EMA reveal both within-day and between-day fluctuations in health and well-being [], laying a foundation for timely, in-the-moment interventions. Furthermore, these responses provide a rich source of patient-reported outcome measures. When combined with objective, sensor-based data representing digital phenotypes, EMA enables the comparison of digital behavior markers with self-reported data.
Despite these advantages, EMA implementation faces challenges, especially in the variability, completeness, and accuracy of participant responses to prompts. Factors such as distraction, self-awareness, boredom, time of day, and interruption burden [] can impact participant responses. Addressing these issues is essential for maintaining the integrity of research findings. Furthermore, the design of notification strategies may dramatically impact response compliance and quality [,].
In this paper, we conduct an examination of EMA response completeness and quality across a spectrum of settings. By leveraging data from multiple studies, we enhance the robustness and generalizability of our conclusions. This broad approach also allows us to consider variables previously unexplored in EMA research. By correlating EMA responses with sensor-derived biomarkers, we will better understand the contextual factors influencing participant engagement with EMA prompts. The findings from this study will inform refinements in EMA methodology and guide future research to improve the reliability of EMA-derived data and the effectiveness of just-in-time interventions.
Previous Work
In-the-moment sampling builds a foundation for designing effective just-in-time interventions []. McDevitt-Murphy et al [] used such a technique to combat anxiety by prompting individuals to write about their worries and initiate physical activity. Similarly, Mair et al [] found such interventions improved physical activity in older adults, while Perski et al [] constructed a technology-driven in-the-moment intervention to reduce substance abuse and promote healthy behaviors. Brenner and Ben-Zeen [] found that letting individuals see the difference between their predicted future EMA reports of mood and actual EMA responses improved the effectiveness of their intervention.
EMA benefits must be weighed with the cost of an increased interruption load. Frequent requests for self-report often lower responsiveness []. Many factors have been considered that impact responsiveness. These include the impact of EMA prompts while a person is performing physical activities [,] or activities that require concentration []. Jeong et al [] and Rintala et al [] studied the relationship between a person’s location (eg, at home vs away from home) and responsiveness, while Pizza et al [] and Ziesemer et al [] found that engagement in social activity was an important consideration. Several studies consider whether prompt time of day influences likelihood of response [,-]. Aminikhanghahi et al [] found that prompting during transitions between activities improved participant responsiveness. Recently, investigators observed a relationship between the complexity of an EMA interaction and responsiveness []. They responded by shortening the questions [], simplifying the interface [], and making use of voice input [].
Researchers also observed that the quality of responses decreases over time [], becoming bistable or skewed [], more habitual [], and less variable [-]. Such trends threaten the reliability of research results. For example, Verbeij et al [] observed decreased convergent validity between reported and objective social media use over 3 weeks of reporting [].
These findings allow researchers to better design EMA-based studies and control for such factors in their analysis. One difficulty, though, is that some of the findings are contradictory. While Jeong et al [], McMillan et al [] and Ziesemer et al [] reported higher response rates (RRs) when a person was alone, Pizza et al [] observed no significant impact of social setting and Ponnada et al [] reported a higher RR when a person was with family or friends. Regarding time of day, some studies found that participants responded more often during afternoons and evenings [,,], while others [,] observed more responses early in the day. Khanshan et al [] found RRs to be higher while participants were active, while Boukhechba et al [] found higher activity was correlated with missing more responses. These discrepancies may indicate the influence of other population and study parameters. We address the need to consider these factors by performing a multistudy analysis.
Furthermore, Wrzus and Neubauer [] emphasized the need to employ sensors in the understanding of the interplay between participant behavior, EMA responsiveness, and response quality. Stach et al [] observe that mobile notification responsiveness is influenced not only by the app delivering the notification but also by user demographics. In our analysis, we leveraged continuously collected sensor data to examine the relationship between EMA responses (as patient-reported outcome measures), digital markers extracted from sensor data (digital phenotyping), and demographics across multiple studies. This comprehensive approach enabled us to uncover patterns and develop recommendations for optimizing EMA methodologies.
Study Goal and Hypotheses
In this study, we performed statistical analysis of EMA responses and sensor data from 9 clinical studies. The overall goal was to provide insights into EMA response patterns that can be used to design and improve future in-the-moment monitoring and intervention studies. We analyzed data from 454 participants to validate the following hypotheses:
First, EMA RR will vary with prompt time of day, number of questions, and sensor-observed activity.
Second, EMA response quality will decrease as a function of the number of days that have elapsed in the study.
Third, both RR and response quality will be impacted by a participant’s behavior context, as modeled by markers extracted from mobile data.
Fourth, differences in EMA RRs and response patterns will exist between studies, influenced by participant demographics (ie, participant age) and study purpose (ie, cognitive intervention vs observational).
Methods
EMA Studies
Daily EMA responses were collected between October 2015 and December 2023 for a total of 454 participants across 9 distinct studies. Reporting of the EMA steps is consistent with the STROBE CREMAS (Strengthening the Reporting of Observational Studies in Epidemiology Checklist for Reporting Ecological Momentary Assessment Studies) guidelines []. In each study, participants received prompts to answer EMA questions using an in-house app running on a smartwatch or tablet. Participants were trained on how to interact with the app by a research assistant and completed practice prompts and tasks before data collection commenced.
The EMA prompts were randomly distributed within predefined time blocks throughout the day. We adjusted these time blocks when necessary to fit participant schedules. When a prompt was issued, an audio tone was played to alert the participant. The participant would then read the question and select their response from options on a mobile screen. If there was no response within 5 minutes, the prompt was reissued, up to a maximum of 5 attempts (2 attempts for dyad study). If the participant still did not respond, we recorded this as a nonresponse and did not issue further prompts until the next designated time block. Parameters for the studies are summarized in . In total, these comprise 145,853 EMA prompts with 115,283 sets of responses.
| Study | Population | Sample (n) | Prompts (n) | Questions and tasks: number and topic | RR (%) | Duration |
| Rural (mc) | Aged 50+ y, cognitive health spectrum, Florida | 33 | 9200 | 8 (social contact, physical activity, mental activity, environment, and motivation), n-back | 77.79 | 2 weeks, day |
| Function (func) | Aged 50+ y, cognitive health spectrum, Pacific Northwest | 26 | 17,923 | 11 (social contact, physical activity, mental activity, environment, and activity type), n-back, audio | 73.85 | 5 weeks, spaced over 16 months, day+night |
| Note-book (mn) | Aged 50+ y, cognitive health spectrum, Pacific Northwest | 45 | 17,369 | 15 (memory strategy, confidence, activity type, environment, and emotion analysis), [n-back, audio] | 79.76 | 2 weeks, 6 months apart, day |
| Brain Booster (bb) | Aged 65+ y, subjective cognitive decline, California | 184 | 3207 | 12 (environment, concentration, and emotion analysis), n-back 1x/day | 54.35 | 2 weeks, 6 months apart, day |
| Compen-satory (cs) | Aged 50+ y, primarily cognitively healthy, Pacific Northwest | 89 | 45,423 | 11 (activity type, environment, memory strategy, and location), n-back, audio | 85.09 | 2 weeks, day |
| Smart-Home (sh) | Aged 55+ y, cognitively healthy, Pacific Northwest | 43 | 32,065 | 7 (social contact, physical activity, mental activity, and activity type), n-back | 78.86 | 2 weeks, 1 month apart |
| Dyad (dyad) | Aged 55+ y, cognitively healthy, West Virginia and Virginia | 10 | 5173 | 8 (dyad interactions and emotion analysis), audio | 91.51 | 2 weeks, day+ night |
| Gsur1 (gsur1) | Students, cognitively healthy, Pacific Northwest | 6 | 3727 | 12 (social contact, physical activity, mental activity, environment, and activity type), n-back | 84.52 | 2 weeks, day |
| Gsur2 (gsur2) | Students, cognitively healthy, Pacific Northwest | 18 | 12,666 | 15 (social contact, physical activity, mental activity, environment, activity type, location, and emotion analysis), n-back, audio | 59.01 | 2 weeks, day |
aNumber of participants enrolled in the study (through December 2023).
bRR: response rate.
cn-back is a 45-second 1-back shape task.
dAudio prompt to describe their day.
eAdditional tasks introduced late in the study (31.2% of mn participants).
fAudio prompt to describe what tasks were assisted by memory strategies that day.
Well-being has been defined multiple ways in the literature [-]. Many studies rely on 1-time questionnaires, like the Satisfaction With Life Scale [], to measure well-being at a single time point. However, well-being is dynamic, fluctuating across different times and contexts []. EMA allows us to capture individuals’ daily behaviors within their natural environments alongside real-time self-reports on well-being. In this analysis, we focus on three dimensions of well-being: mental sharpness, physical fatigue, and stress.
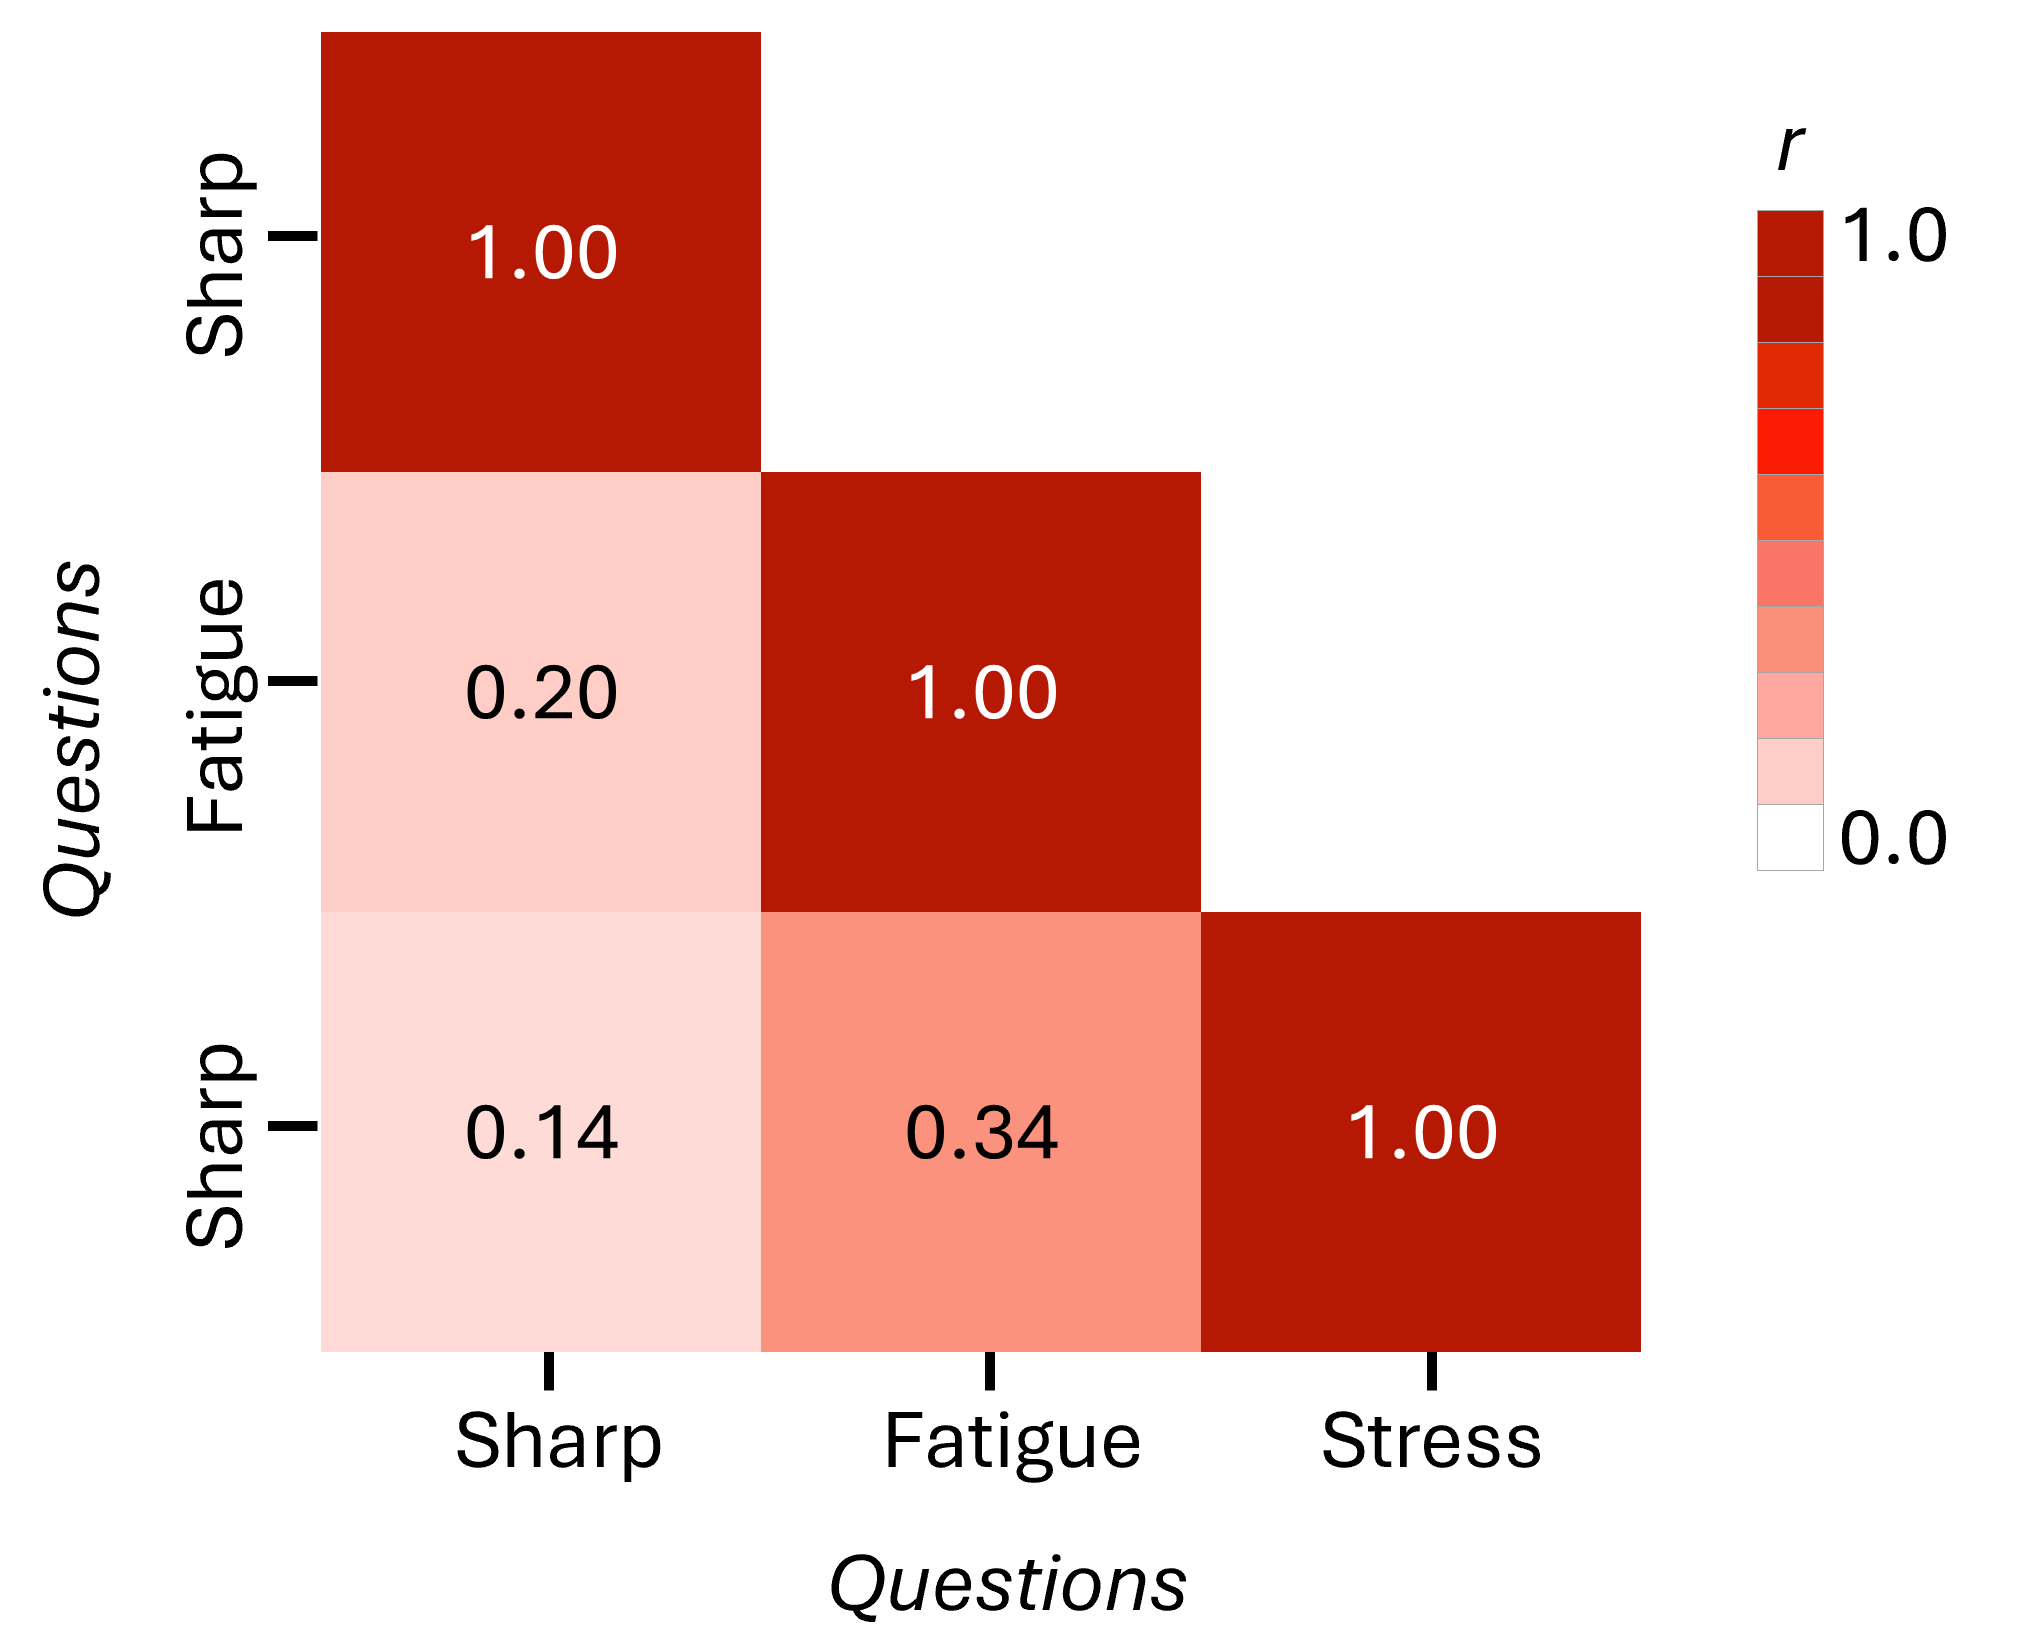
Each study included subjective questions that examined (1) = the person’s mental sharpness, (2) = the person’s physical fatigue, and (3) = the person’s level of stress, all self-reported and relevant to the point in time (eg, immediately and up to the previous 2 h) when they received the query. The Likert scales varied between studies, so we normalized the values to a 1‐5 range. Where needed, we inverted responses for negative questions so that a higher-valued response is more positive in each case (eg, indicates feeling greater amounts of mental sharpness; indicates feeling less physically fatigued; indicates feeling less stressed. plots the relative frequency of each response to the 3 question categories. The studies are ordered primarily by the cognitive health status of participants and secondarily by age. As the plots demonstrate, most of the responses are high but do vary among studies. Notably, the similarity in response between stress and fatigue is higher than other question pairs. This finding is consistent with the correlation that exists between responses to the 3 questions, shown in .
Ethical Considerations
These studies were reviewed and approved by the institutional review boards (IRB protocol 14460) at Washington State University and the University of California at Davis (No. 19784). To participate in any of the studies, participants needed to understand English and sign an informed consent; each person received compensation between US $20 and US $125 for their participation. All data were anonymized before performing analyses.
Statistical Analysis
RR and Quality
We conducted statistical analyses on the data to examine RR, completeness, and quality for each participant and study. Our app records each time a prompt is delivered to the participant. From these records, we calculate RR as the ratio of occurrences when a participant answered at least 1 question to the total number of prompts. The analysis also considers the prompt time of day (morning before 12 PM, afternoon between 12 PM and 5 PM, and evening after 5 PM), day of week, study duration, and number of questions per prompt. Researchers suggest that user demographics may impact preference for EMA delivery strategies []. We examine this factor by considering differences among the studies and between the set of studies involving older adults (aged 50 y or older) and those involving younger adults.
Response completeness reflects the percentage of questions that were answered for the occasions when the participant responded. We excluded nonquestion tasks, such as daily n-back shape tests (all but dyad) and audio descriptions of the day’s activities (func, mn, cs, dyad, gsur1, and gsur2). Rather than impute missing values, analysis of EMA-reported values only considers completed responses.
Response quality measures habituation that may occur over the duration of the study, resulting in less response variance and state awareness. As reported elsewhere [-], we quantified careless responses as the percent responses that fall near (within 0.2) each participant’s mode response and also calculated response variance. Changes in response quality may occur over the course of the study as a motivation to provide high-quality responses wanes. Thus, we computed the change in variation and careless responses between the first and second half of the study for each participant.
To gather sensor-derived behavior context, we collected continuous sensor data from Apple watches for 95 participants in the bb study and all participants from the dyad, func, cs, mn, mc, sh, gsur1, and gsur2 studies. In the ihs study, we collected data from ambient sensors installed in participant homes. The smartwatches collected acceleration and rotation readings at 10 Hz and recorded location (latitude, longitude, and altitude) every 5 minutes, or more frequently when movement exceeded a baseline. Data were stored on the watch, encrypted, and downloaded to a password-protected server when the watches were returned. From the raw location data, we defined the participant’s home as the location visited most often between 2 AM and 9 AM. We then calculated the distance and bearing from home for each location. Behavior context features were defined as “activity level” (total acceleration) and time “at home” (fraction of time spent at home), calculated for 30 minutes ending at the time the participant provides an EMA response. The data collection app was developed in-house using Swift. Collecting data at these rates ensured 1 full day of data on a single charge.
For studies collecting data only during the day (), participants wore the watch on their nondominant arm during the day and charged it at night. In studies collecting both day and night data, participants were given 2 watches—one worn during the day and charged at night, and the other worn at night and charged during the day. In the smart home study, EMA responses were reported using a tablet; in all other studies, they were reported via the smartwatch.
In the smart home study, 2‐4 sensors were placed in each room. These were either passive infrared motion sensors with an ambient light sensor or magnetic door sensors with an ambient temperature sensor. Motion sensors detected movement, providing location data within the home. Activity level was estimated by counting motion sensor readings. If an external door was opened and closed, followed by at least 5 minutes of no motion sensor activity, the participant was designated as out of home. The “at home” context quantified the fraction of time spent at home in the 30 minutes before an EMA response.
Another context feature was proximity to a change point. A change point occurs when there is a shift in the underlying process of a time series, such as transitioning from one activity to another. In an earlier work by Aminikhanghahi et al [], we designed an algorithm to detect these points from continuous sensor data and found that interacting with participants during these times improved RRs and task success. We used the same method here to determine proximity to a change point.
We calculated correlations between the 3 context features (activity level, at home, and change point) and response compliance. Here, a lack of response to a particular prompt is assigned a “compliance” value of 0.0, a complete response is assigned a value of 1.0, and a partial response (some questions answered, some not) is assigned in the range 0.0‐1.0, corresponding to the relative number of questions that were answered.
Study Differences
In this analysis, we selected 9 studies as the basis for comparing EMA delivery strategies and responses. The selection was based on the consistency of the technical data collection tools and hardware, which minimized the influence of these factors on the results. A single software interface was used to deliver EMA prompts across all studies, and the same app collected sensor data in all smartwatch studies, following a protocol similar to that used in the smart home study. Context features were extracted uniformly from the sensor data across datasets.
Participants in all studies were instructed to perform their normal daily routines without changing their behavior to accommodate the data collection. This consistency allowed us to focus on the differences that existed between the settings. Specifically, the participant groups differed across studies in terms of location (4 regions within the United States), age, and cognitive health, supporting generalization of the findings to other EMA studies. The studies also differed in length and number of EMA questions and tasks. These differences represent the focus of our analysis.
We examined differences in EMA response dynamics across the 9 studies. Our approach is twofold; we report results for each study individually and collectively and analyze differences in EMA responses within and between these studies. This technique will allow us to examine the extent to which EMA response patterns differ between studies, using within-study changes as a comparison baseline. We use dynamic time warping (DTW) as a similarity measure because the technique measures similarity between time series that differ in length as well as values. In the case of the question, we also visually compare responses over time for studies that focus on cognitive health support for older adults (bb and mn) with observational studies involving cognitively healthy adults (dyad, gsur1, and gsur2).
To deepen the analysis, we fit ARIMA (Autoregressive Integrated Moving Average) models to the aggregated EMA responses for each question type. The mean response was computed across participants for the first 48 responses, producing a single representative time series. The resulting model parameters indicated how well the shape of responses over time could be modeled.
Results
RR Findings
RR across all participants was 79.95%. This is within 0.76% of the 79.19% average rate Wrzus and Neubauer [] reported in a survey of 417 EMA studies. Among the prompts that received participant responses, the response completion rate was 88.37%.
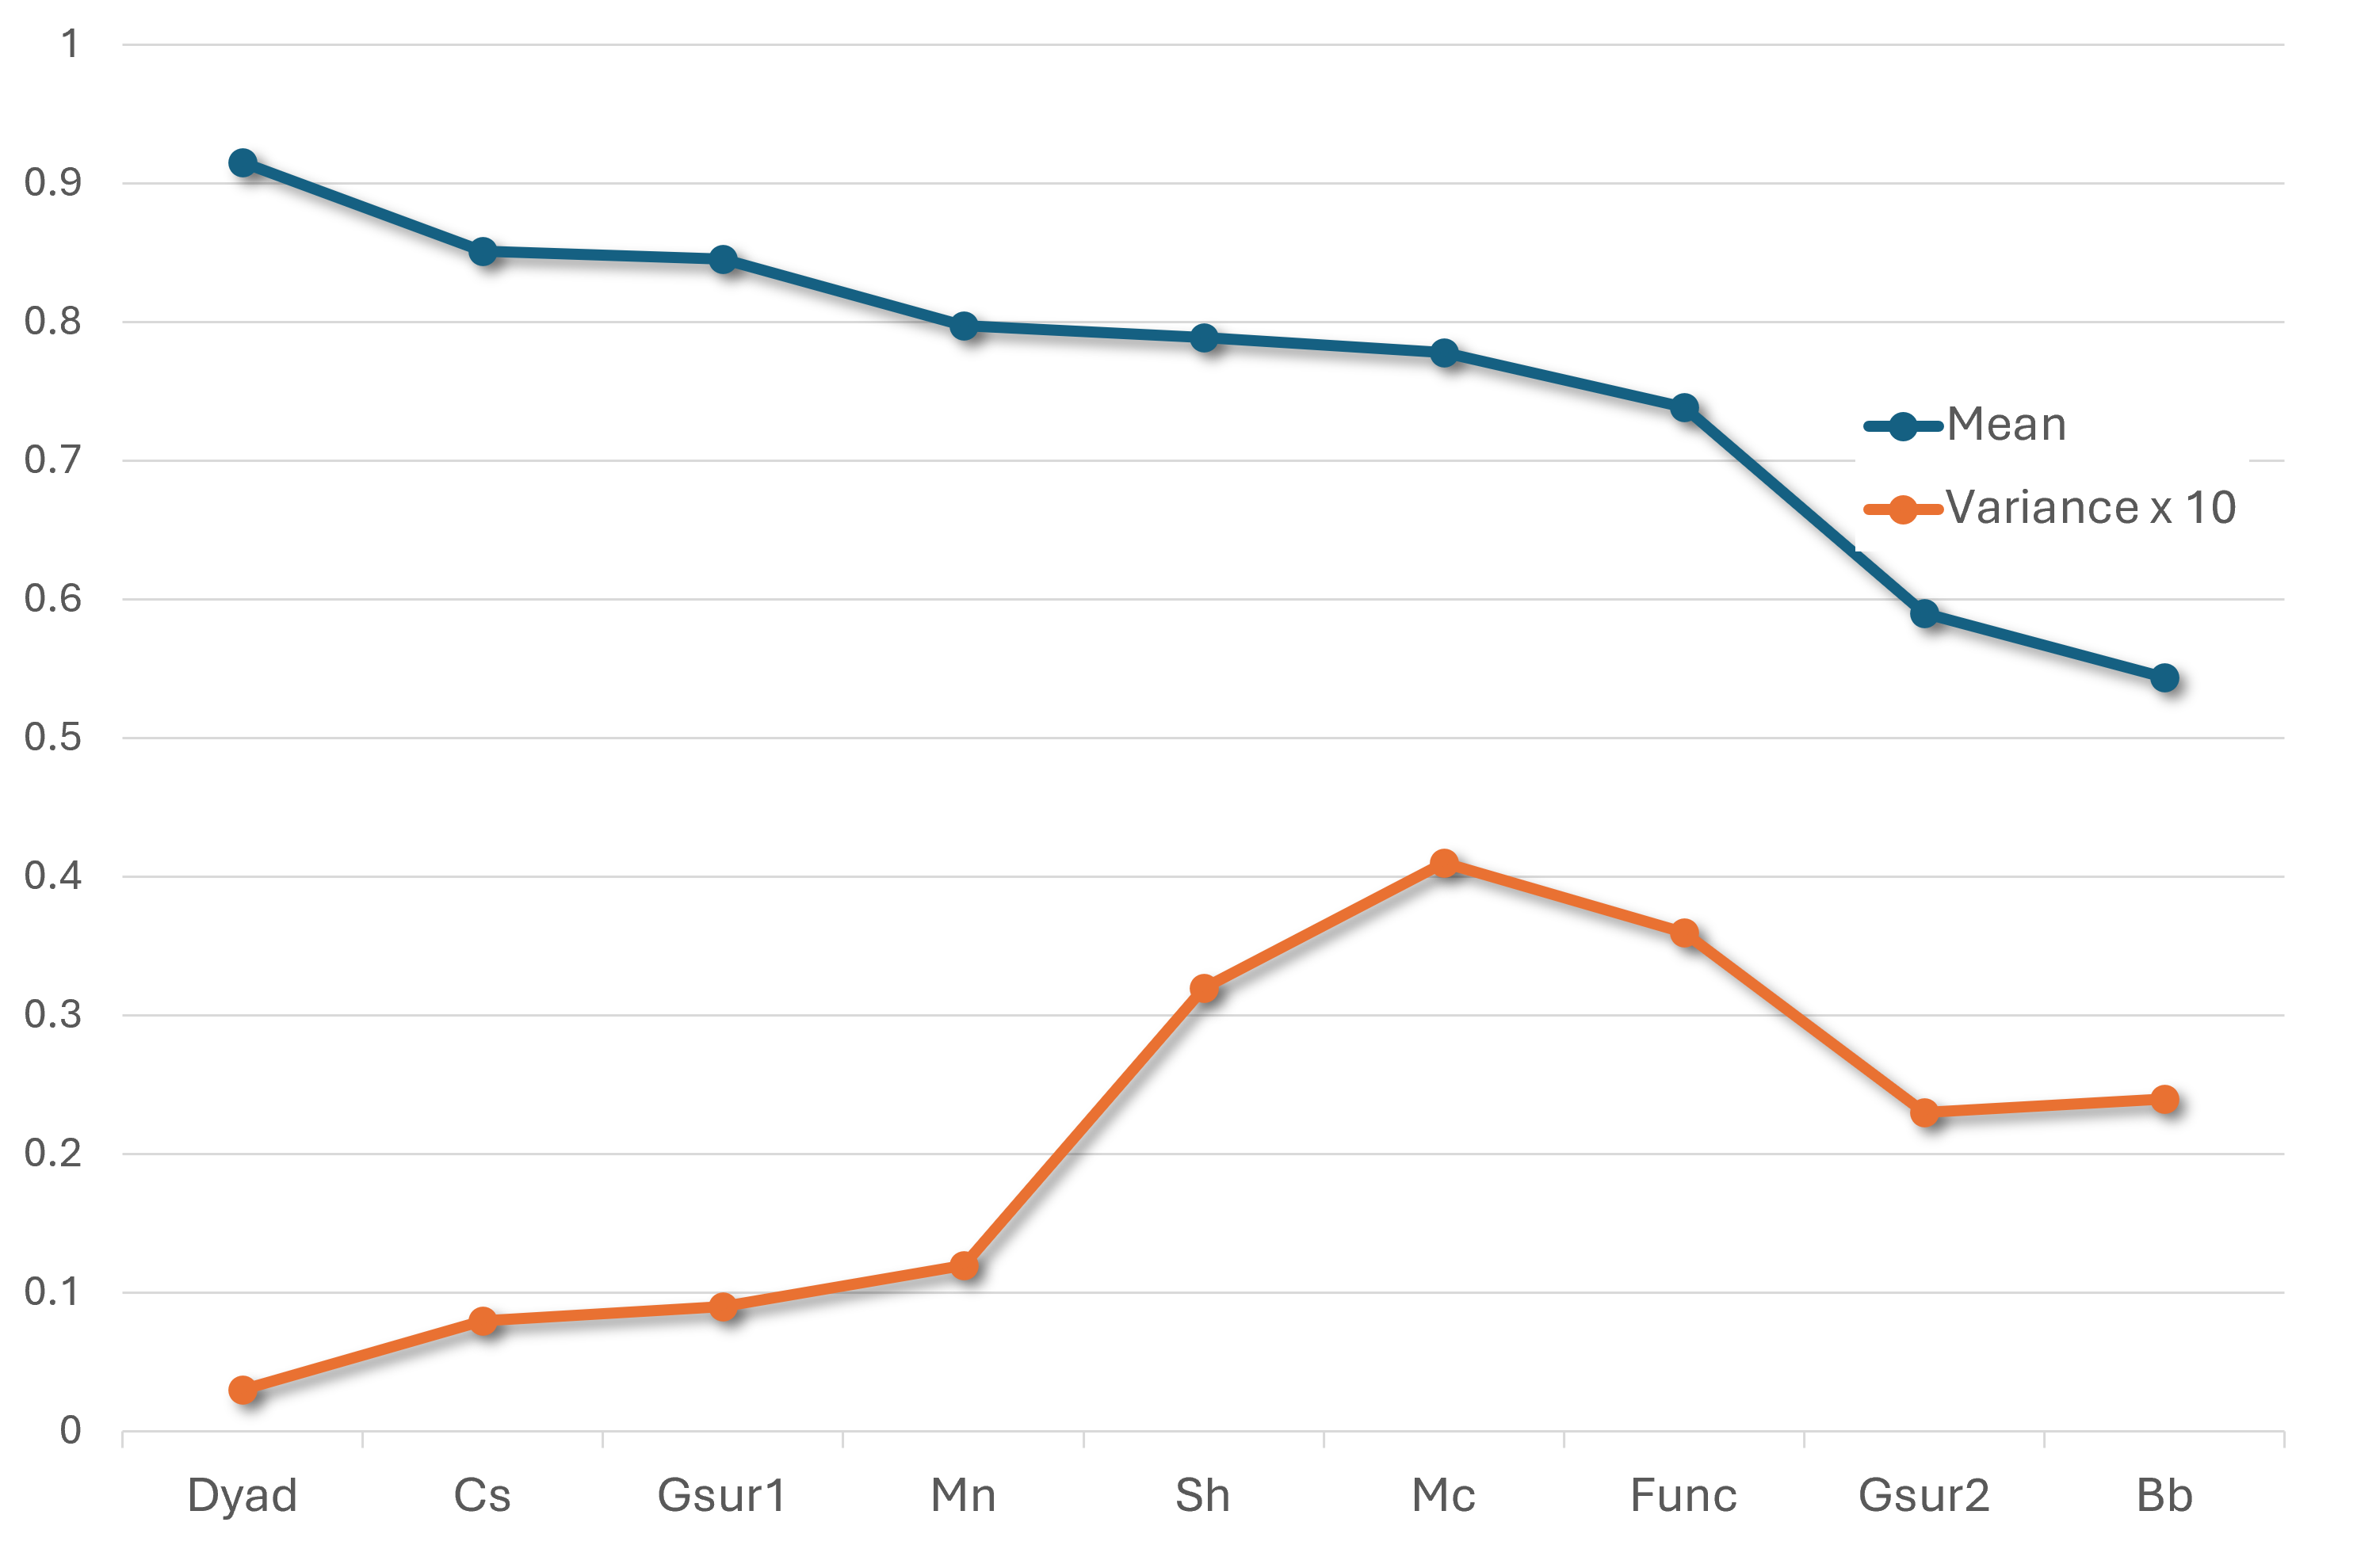
plots RR for the studies, ordered from largest to smallest. Response variance is quite different among the studies. Notably, response variance increased as the mean RR decreased. shows the overall most popular time of day for responding to EMA prompts. However, these results vary based on participant age. Only considering studies with older adults (age 50 y or older), participants were more responsive in the evening than morning (by 3.95) or afternoon (by 3.58). In contrast, younger adult RR remained fairly uniform throughout the day, with afternoon showing the highest rate. Weekday and weekend prompts yielded very similar RR overall (a difference of 0.04). However, this varied by study and age group. Specifically, while weekend response was higher by 3.25 for younger adults, the rate decreased for older adults by 0.27. These findings highlight the role that participant demographics play in understanding EMA responsiveness; prompt time alone may not be a strong indicator of responsiveness.
| Time | Overall response rate (%) | Response rate among older adults (%) | Response rate among younger adults (%) | |
| Time of day | ||||
| Morning | 79.02 | 80.60 | 64.86 | |
| Afternoon | 79.08 | 80.97 | 64.97 | |
| Evening | 82.31 | 84.55 | 64.45 | |
| Day of week | ||||
| Weekday | 80.43 | 82.46 | 63.93 | |
| Weekend | 80.39 | 82.19 | 67.18 | |
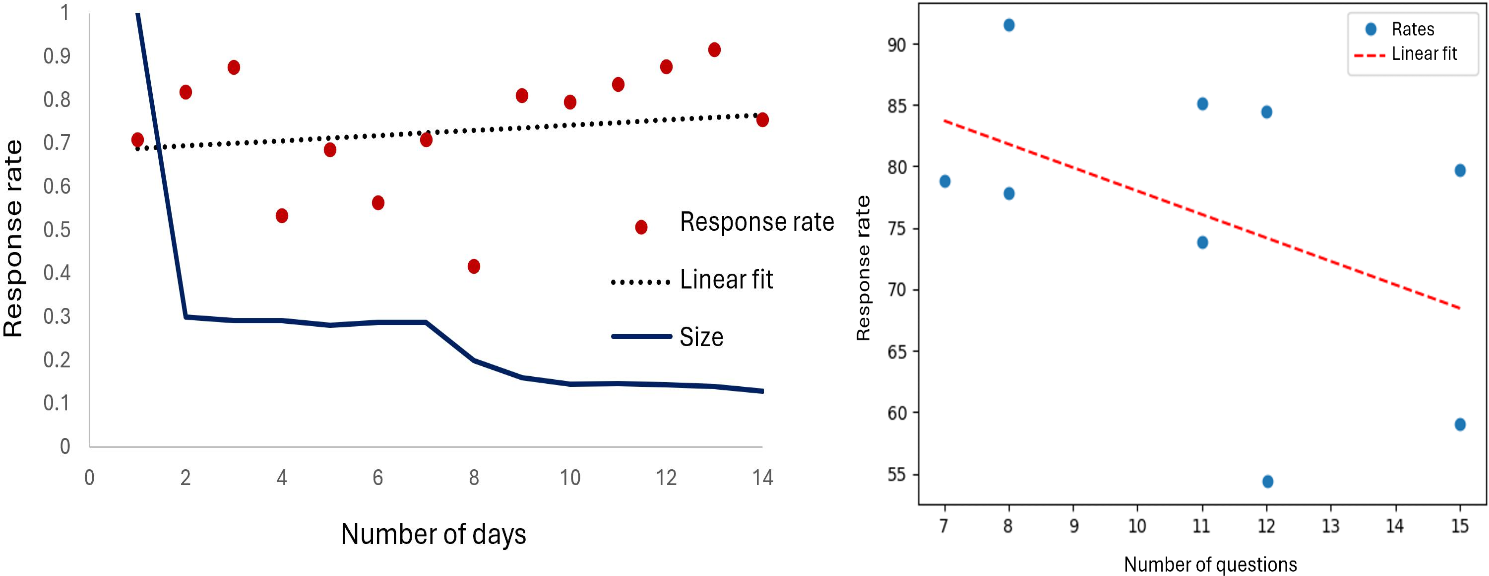
(left) plots EMA RR as a function of the number of days that elapsed since the beginning of the study for each participant. The linear fit line has a positive slope of 0.078, indicating that the duration does not negatively impact RR. At the same time, the fraction of participants still collecting data is much smaller at the end of this time span. A nonsignificant small positive correlation exists between the study duration and RR (r=0.100, P=.29). This may be due to the EMA prompts becoming more integrated into the participant’s routine and their gaining familiarity with the questions and methods of responding.
(right) shows RR as a function of the number of questions asked at the EMA prompt, together with the fitted line. Correlation between the number of questions asked during an EMA prompt and RR is moderate and negative (r=−0.433, P<.001). The line fitting this trend has a slope of −1.90. This finding is consistent with previous work indicating that individuals are less likely to respond when each EMA prompt requires a large time interruption and corresponding task burden [].
Response Quality
summarizes participant responses and response quality. The average response value across all studies is relatively high, as is the percentage of responses near the mode. There was a noticeable shift toward response uniformity over time, evidenced by a significant increase in carelessness and decrease in variance. Results from individual studies are shown in . Although the earlier analysis showed that RR did not decline over the study, the increase in careless responses and decrease in variance indicates a possible increase in habitual responses to EMA questions [] as participants got bored or felt time pressure to respond to EMA notifications. Some studies inserted a break of 1+ months during data collection. For these studies, we calculated changes within the period before the break and the period after the break. The trends remain the same: carelessness increased and variance decreased over time. These changes are smaller, possibly due to the decreased time (typically 7 d) being examined.
| Metric | Value |
| 3.524 (1.072) | |
| 4.157 (0.758) | |
| 4.432 (0.652) | |
| Careless % | 55.71 |
| Interparticipant variance | 0.611 |
| Carelessness change | 0.22 (P<.001) |
| Variance change | −0.363 (P<.001) |
| Prebreak carelessness change | 0.04 (P<.001) |
| Prebreak variance change | −0.082 (P<.001) |
| Postbreak carelessness change | 0.09 (P<.001) |
| Postbreak variance change | −0.329 (P<.001) |
afunc, mn, bb, and sh studies.
Alignment With Sensor-Observed Behavior
Relationships between RRs and sensor-detected states were also examined. A correlation of r=0.045 (P<.001) exists between RR and activity level over the previous 30 minutes, r=0.174 (P<.001) between RR and time spent at home over the previous 30 minutes, and r=0.124 (P<.001) between RR and nearness to detected activity change points. summarizes the results for individual studies.
RR correlation with activity level is positive but small. This finding, considered together with the discrepancies observed in previous studies [,], may indicate that the nature of the person’s activity needs to be examined to understand the impact on prompt response. Correlations with at-home time and change points were larger, although still small. Individuals may not want to interrupt their activities, particularly in social situations, to answer lengthy EMA questions. In these contexts, they may ignore the prompt and wait until the next time block. As with our previous study examining RR and change points in smart homes [], we observe that prompting near a change point improve responsiveness for all studies.
EMA Differences Between Studies
Results from the previous analyses reveal that differences in EMA response compliance and quality may occur as a function of study and participant characteristics. Here, we delve further into EMA response differences between studies. First, we measure the distance (inverse similarity) between EMA time series using DTW. Across all studies and participants, the average within-study DTW distance was 14.141 (SD 11.957) overall (sharp 15.357, highest dyad=36.111, lowest bb=11.486; fatigue 15.014, highest dyad=36.489, lowest bb=10.299; stress 12.051; and highest dyad=33.511, lowest bb=7.069).
In contrast, the average between-study DTW distance was 33.246 (SD 4.971) overall (sharp 44.848, highest dyad/bb=81.448, lowest mc/bb=16.262; fatigue 29.365, highest mn/func=54.927, lowest mc/bb=12.434; stress 25.526, highest mn/func=52.05, lowest mc/bb=8.759). This represents a 135% distance increase over the within-study distances. The large increase indicates that while response variability exists between participants, an even larger difference exists between studies. lists some of the parameters that may influence these differences; further investigation may identify more contributing factors.
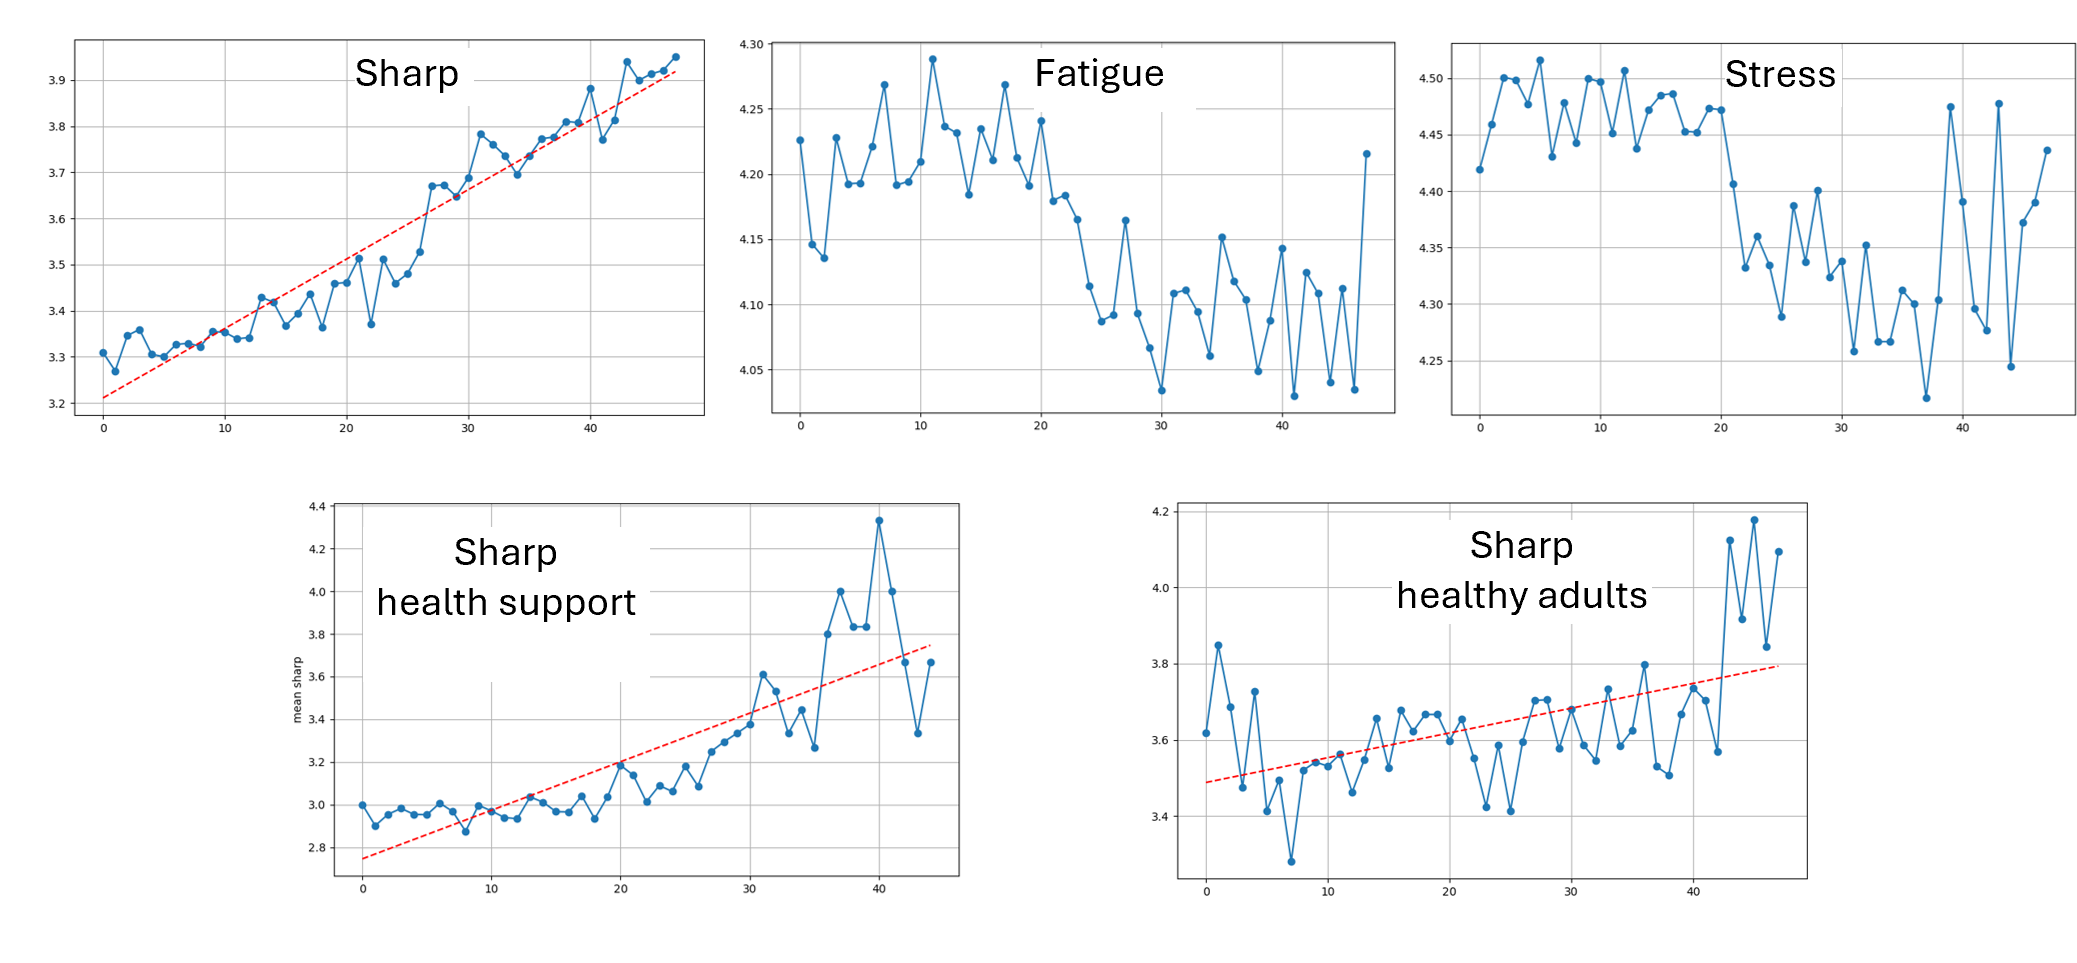
Plots of the aggregated EMA responses for the 3 question types are shown in . The shapes of the aggregated time series are different between the 3 question categories. The trend is consistently positive, while there are less noticeable trends for the other questions.
Because 2 of the studies (bb and mn) represent interventions, we examine differences in the response trends between these studies and the 2 observational studies with cognitively healthy older adults (dyad and cs). Aggregated over all 9 studies, the slope of the response fitted line is 0.018, with a y-intercept of 3.181. The fitted line for the intervention studies has a slope of 0.023 (an increase of 0.005) and y-intercept of 2.745 (a decrease of 0.436), while for observational studies with cognitively healthy older adults, the fitted line has a slope of 0.005 (a decrease of 0.013) and y-intercept of 3.449 (an increase of 0.614). Here, we observe that older adults receiving interventions start at a lower self-reported mentally sharp value but indicate that the sharpness increases over the study duration. In comparison, the cognitively healthy adults start at a higher sharp reported value and have a lesser amount of change in reported values during the study.
presents the ARIMA parameters for the response categories sharp, fatigue, and stress. The log-likelihood values are high for all models, indicating a good fit. Similarly, the negative Akaike Information Criterion and Bayesian Information Criterion values suggest that the models strike a balance between fitting the data well and avoiding unnecessary complexity. The P values for the Moving Average of order 1 terms (P<.001 for all categories) indicate that errors at lag-1 are significant for predicting the next value in the time series. In addition, the Ljung-Box test results, with values greater than 0.05, suggest that the residuals are not significantly autocorrelated, meaning the models capture relevant patterns beyond mere autocorrelation.
| Metric | Sharp | Fatigue | Stress |
| Log likelihood (higher is better) | 74.19 | 72.39 | 64.09 |
| AIC (lower is better) | −142.39 | −140.79 | −124.17 |
| BIC (lower is better) | −136.84 | −137.09 | −120.47 |
| MA(1) | −0.63 (P<.001) | −0.67 (P<.001) | −0.61 (P<.001) |
| Ljung-Box test | 0.85 | 0.21 | 0.07 |
aAIC: Akaike Information Criterion.
bBIC: Bayesian Information Criterion.
cMA(1): Moving Average of order 1.
Discussion
Principal Results
Early detection and intervention, crucial for reducing health care costs and enhancing quality of life, depend on timely reports of health status. This cross-study analysis highlights the pivotal role of EMA design in obtaining frequent, accurate EMA responses. In particular, we observed that participant demographics and study parameters markedly influence EMA response values, compliance, and quality. In particular, timing of EMA prompts varied in effectiveness depending on participant age. On the other hand, the negative impact of lengthy EMA interactions was consistent across all of the studies. Supporting eyes-free or hands-free interactions [,] may reduce interruption burden. Similarly, employing more frequent but shorter EMA sessions, or μEMA [], may improve responsiveness. These findings support the first hypothesis and highlight the need to tailor EMA prompt strategies to specific participant and study characteristics.
A consistent observation was an increase in habitual, careless responses over the study duration, supporting the second hypothesis. In this study, 2087 of the 17,939 sessions (11.63%) were started but not completed, so researchers may consider strategies such as randomizing question or task order [], gamifying the data collection process [], or allowing selected questions to be skippable [], as some may hold more interest. Additional factors, such as time pressure from concurrent activities or individual personality traits [], may also influence responses. Ultimately, these considerations can be included in the study design.
Integrating sensor-based behavioral context is key to improving EMA studies. As hypothesized in the third hypothesis, our analysis revealed a significant relationship between sensor-derived biomarkers and EMA responsiveness. Analyzing these biomarkers could benefit personalized EMA design. In addition, timing EMA prompts close to detecting activity transitions may improve RR and quality.
Finally, our results showed that consistent with the fourth hypothesis, EMA response dynamics varied according to study parameters such as participant age and study type. We observed that response values increased more dramatically for intervention than observational studies, perhaps due to participants viewing their intervention involvement as beneficial, as noted in previous literature [60]. The response series were well fit by statistical models such as ARIMA. Such models provide a basis to compare EMA trajectories between groups and predict future response patterns.
Limitations
This study had several limitations. Although we examined factors like study purpose and participant age, other variables, such as education, race or ethnicity, employment status, environment, and cognitive or physical health, were not examined. In addition, we did not consider the impact of breaks of 1 or more days in data collection. Restarting data collection after a break could affect EMA compliance and response quality.
Another limitation involves the duration of the studies. While some studies spanned 6 months or more, others lasted only 2 weeks. Extending the duration of all studies would enhance the generalizability of our time series findings. The sample sizes also varied considerably, with smaller young adult samples compared with older adult studies. In addition, slight differences in EMA question wording between studies, though normalized, may have influenced responses. Greater uniformity in future studies would provide more consistent data.
A further limitation was the lack of diversity in medical conditions. While we focused on individuals with varying levels of cognitive decline, other physical or psychiatric conditions were not represented. Including a wider range of medical conditions in follow-up studies would provide a more comprehensive understanding of EMA responses across different health conditions.
While the studies were consistent in their data collection hardware and software, technology influences results through factors like accessibility, battery life, ease of use, device familiarity, and extractable digital markers. Future studies can systematically consider alternative technologies.
Finally, this analysis concentrated on a subset of well-being factors. Since well-being encompasses broader emotional, social, and physical domains, future research can include additional dimensions for a more holistic analysis. In particular, a next step can be to evaluate the impact of rural versus urban residence as well as the quality of the build environment on EMA responses.
Conclusions
This study offers insights into the factors that influence EMA responses and lays the groundwork for further exploration. Future studies should broaden the range of participant, study, and interaction characteristics to better inform EMA design strategies. In addition, expanding the range of sensor-based behavioral markers will enhance understanding of how changes in routine and behavior can enrich EMA data collection. Addressing these areas will help refine EMA methodologies, leading to more personalized and effective health monitoring and intervention technologies.
Acknowledgments
This work is supported in part by NIA grants R01AG066748, R01AG065218, and R35AG071451. The work was also supported in part by DOD grant AZ 190055.
Conflicts of Interest
None declared.
Bar charts illustrating the distribution of Likert responses for the sharp, fatigue, and stress ecological momentary assessment questions across studies. Higher scores are consistent with better well-being.
PNG File, 53 KBLeft: percentage careless responses (within 0.2 of participant mode) and interparticipant variance (multiplied by 100 to normalize scale). Right: difference in percentage near the mode and variance between the first and second half of data collection for each participant.
PNG File, 468 KBPearson correlation between ecological momentary assessment response and behavior context.
PNG File, 213 KBReferences
- Opoku Asare K, Terhorst Y, Vega J, Peltonen E, Lagerspetz E, Ferreira D. Predicting depression from smartphone behavioral markers using machine learning methods, hyperparameter optimization, and feature importance analysis: exploratory study. JMIR Mhealth Uhealth. Jul 12, 2021;9(7):e26540. [CrossRef] [Medline]
- Kraiss JT, Kohlhoff M, Ten Klooster PM. Disentangling between- and within-person associations of psychological distress and mental well-being: an experience sampling study examining the dual continua model of mental health among university students. Curr Psychol. Mar 1, 2022;42(20):1-12. [CrossRef] [Medline]
- Kheirkhahan M, Nair S, Davoudi A, et al. A smartwatch-based framework for real-time and online assessment and mobility monitoring. J Biomed Inform. Jan 2019;89:29-40. [CrossRef] [Medline]
- Knell G, Gabriel KP, Businelle MS, Shuval K, Wetter DW, Kendzor DE. Ecological momentary assessment of physical activity: validation study. J Med Internet Res. Jul 18, 2017;19(7):e253. [CrossRef] [Medline]
- Rao C, Di Lascio E, Demanse D, Marshall N, Sopala M, De Luca V. Association of digital measures and self-reported fatigue: a remote observational study in healthy participants and participants with chronic inflammatory rheumatic disease. Front Digit Health. 2023;5:1099456. [CrossRef] [Medline]
- Younis EMG, Kanjo E, Chamberlain A. Designing and evaluating mobile self-reporting techniques: crowdsourcing for citizen science. Pers Ubiquit Comput. Apr 2019;23(2):329-338. [CrossRef]
- de Brito JN, Loth KA, Tate A, Berge JM. Associations between parent self-reported and accelerometer-measured physical activity and sedentary time in children: ecological momentary assessment study. JMIR Mhealth Uhealth. May 19, 2020;8(5):e15458. [CrossRef] [Medline]
- Doherty K, Balaskas A, Doherty G. The design of ecological momentary assessment technologies. Interact Comput. May 17, 2020;32(3):257-278. [CrossRef]
- van Berkel N, Ferreira D, Kostakos V. The experience sampling method on mobile devices. ACM Comput Surv. Nov 30, 2018;50(6):1-40. [CrossRef]
- Rey B, Lee B, Choe EK, Irani P. Investigating in-situ personal health data queries on smartwatches. Proc ACM Interact Mob Wearable Ubiquitous Technol. Dec 21, 2022;6(4):1-19. [CrossRef]
- Howard AL, Lamb M. Compliance trends in a 14-week ecological momentary assessment study of undergraduate alcohol drinkers. Assessment. Mar 2024;31(2):277-290. [CrossRef] [Medline]
- van Berkel N, Goncalves J, Hosio S, Sarsenbayeva Z, Velloso E, Kostakos V. Overcoming compliance bias in self-report studies: a cross-study analysis. Int J Hum Comput Stud. Feb 2020;134:1-12. [CrossRef]
- Möller A, Kranz M, Schmid B, Roalter L, Diewald S. Investigating self-reporting behavior in long-term studies. Presented at: CHI ’13: CHI Conference on Human Factors in Computing Systems; Apr 27 to May 2, 2013:2931-2940; Paris, France. [CrossRef]
- Balaskas A, Schueller SM, Cox AL, Doherty G. Ecological momentary interventions for mental health: a scoping review. PLoS ONE. 2021;16(3):e0248152. [CrossRef] [Medline]
- McDevitt-Murphy ME, Luciano MT, Zakarian RJ. Use of ecological momentary assessment and intervention in treatment with adults. Focus (Am Psychiatr Publ). 2018;16(4):370-375. [CrossRef] [Medline]
- Mair JL, Hayes LD, Campbell AK, Buchan DS, Easton C, Sculthorpe N. A personalized smartphone-delivered just-in-time adaptive intervention (JitaBug) to increase physical activity in older adults: mixed methods feasibility study. JMIR Form Res. Apr 7, 2022;6(4):e34662. [CrossRef] [Medline]
- Perski O, Hébert ET, Naughton F, Hekler EB, Brown J, Businelle MS. Technology-mediated just-in-time adaptive interventions (JITAIs) to reduce harmful substance use: a systematic review. Addiction. May 2022;117(5):1220-1241. [CrossRef] [Medline]
- Brenner CJ, Ben-Zeen D. Affective forecasting in schizophrenia: comparing predictions to real-time ecological momentary assessment (EMA) ratings. Psychiatr Rehabil J. 2014;37(4):316-320. [CrossRef] [Medline]
- Khanshan A, Van Gorp P, Nuijten R, Markopoulos P. Assessing the influence of physical activity upon the experience sampling response rate on wrist-worn devices. Int J Environ Res Public Health. Oct 10, 2021;18(20):10593. [CrossRef] [Medline]
- Mishra V, Caine K, Lowens B, Kotz D, Lord S. Investigating contextual cues as indicators for EMA delivery. Proc ACM Int Conf Ubiquitous Comput. Sep 2017;2017:935-940. [CrossRef] [Medline]
- Yan X, Raj S, Huang B, Park S, Newman M. Toward lightweight in-situ self-reporting: an exploratory study of alternative smartwatch interface designs in context. ACM Trans Interactive, Mobile, Wearable Ubiquitous Technol. 2020;4(4):1-22. [CrossRef]
- Jeong H, Kim H, Kim R, Lee U, Jeong Y. Smartwatch wearing behavior analysis: a longitudinal study. ACM Trans Interactive, Mobile, Wearable Ubiquitous Technol. 2017;1(3):1-31. [CrossRef]
- Rintala A, Wampers M, Myin-Germeys I, Viechtbauer W. Momentary predictors of compliance in studies using the experience sampling method. Psychiatry Res. Feb 29, 2020;286:112896. [CrossRef] [Medline]
- Pizza S, Brown B, McMillan D, Lampinen A. Smartwatch in vivo. Presented at: Proceedings of the 2016 CHI Conference on Human Factors in Computing Systems; May 7-16, 2016:5456-5469; San Jose, CA. [CrossRef]
- Ziesemer K, König LM, Boushey CJ, et al. Occurrence of and reasons for “Missing Events” in mobile dietary assessments: results from three event-based ecological momentary assessment studies. JMIR Mhealth Uhealth. Oct 14, 2020;8(10):e15430. [CrossRef] [Medline]
- Ponnada A, Li J, Wang SD, et al. Contextual biases in microinteraction ecological momentary assessment (μEMA) non-response. Proc ACM Interact Mob Wearable Ubiquitous Technol. Mar 2022;6(1):1-24. [CrossRef] [Medline]
- McMillan D, Brown B, Lampinen A, McGregor M, Hoggan E, Pizza S. Situating wearables: smartwatch use in context. Presented at: CHI ’17: Proceedings of the 2017 CHI Conference on Human Factors in Computing Systems; May 6-11, 2017:3582-3594; Denver, Colorado, USA. [CrossRef]
- Visuri A, Sarsenbayeva Z, van Berkel N, et al. Quantifying sources and types of smartwatch usage sessions. Presented at: CHI ’17; May 6-11, 2017:3569-3581; Denver, Colorado, USA. [CrossRef]
- Boukhechba M, Cai L, Chow PI, et al. Contextual analysis to understand compliance with smartphone-based ecological momentary assessment. Presented at: PervasiveHealth ’18; May 21-24, 2018:232-238; New York, NY, USA. [CrossRef]
- Sun J, Rhemtulla M, Vazire S. Eavesdropping on missing data: what are university students doing when they miss experience sampling reports? Pers Soc Psychol Bull. Nov 2021;47(11):1535-1549. [CrossRef] [Medline]
- Aminikhanghahi S, Schmitter-Edgecombe M, Cook DJ. Context-aware delivery of ecological momentary assessment. IEEE J Biomed Health Inform. Apr 2020;24(4):1206-1214. [CrossRef] [Medline]
- Ponnada A, Haynes C, Maniar D, Manjourides J, Intille S. Microinteraction ecological momentary assessment response rates: effect of microinteractions or the smartwatch? Proc ACM Interact Mob Wearable Ubiquitous Technol. Sep 2017;1(3):92. [CrossRef] [Medline]
- Ponnada A, Wang S, Chu D, Do B, Dunton G, Intille S. Intensive longitudinal data collection using microinteraction ecological momentary assessment: pilot and preliminary results. JMIR Form Res. Feb 9, 2022;6(2):e32772. [CrossRef] [Medline]
- Kim YH, Chou D, Lee B, et al. MyMove: facilitating older adults to collect in-situ activity labels on a smartwatch with speech. Presented at: CHI ’22: CHI Conference on Human Factors in Computing Systems; Apr 29 to May 5, 2022; New Orleans, LA, USA. [CrossRef]
- Eisele G, Vachon H, Lafit G, et al. The effects of sampling frequency and questionnaire length on perceived burden, compliance, and careless responding in experience sampling data in a student population. Assessment. Mar 2022;29(2):136-151. [CrossRef] [Medline]
- Haslbeck JMB, Ryan O. Recovering within-person dynamics from psychological time series. Multivariate Behav Res. 2022;57(5):735-766. [CrossRef] [Medline]
- Eisele G, Vachon H, Lafit G, et al. A mixed-method investigation into measurement reactivity to the experience sampling method: the role of sampling protocol and individual characteristics. Psychol Assess. Jan 2023;35(1):68-81. [CrossRef] [Medline]
- Csikszentmihalyi M, Larson R. Validity and reliability of the experience-sampling method. In: Flow and the Foundations of Positive Psychology. Springer; 2014:35-54. [CrossRef]
- Fuller-Tyszkiewicz M, Skouteris H, Richardson B, Blore J, Holmes M, Mills J. Does the burden of the experience sampling method undermine data quality in state body image research? Body Image. Sep 2013;10(4):607-613. [CrossRef]
- Vachon H, Bourbousson M, Deschamps T, et al. Repeated self-evaluations may involve familiarization: an exploratory study related to ecological momentary assessment designs in patients with major depressive disorder. Psychiatry Res. Nov 30, 2016;245:99-104. [CrossRef] [Medline]
- Verbeij T, Pouwels JL, Beyens I, Valkenburg PM. The accuracy and validity of self-reported social media use measures among adolescents. Comput Hum Behav Rep. Jan 2021;3:100090. [CrossRef]
- Maher JP, Rebar AL, Dunton GF. Ecological momentary assessment is a feasible and valid methodological tool to measure older adults’ physical activity and sedentary behavior. Front Psychol. 2018;9:1485. [CrossRef] [Medline]
- Silvia PJ, Kwapil TR, Eddington KM, Brown LH. Missed beeps and missing data: dispositional and situational predictors of nonresponse in experience sampling research. Soc Sci Comput Rev. 2013;31(4):471-481. [CrossRef]
- van Berkel N, Goncalves J, Koval P, et al. Context-informed scheduling and analysis: improving accuracy of mobile self-reports. Presented at: CHI Conference on Human Factors in Computing Systems; May 4-9, 2019:51; Glasgow, Scotland, UK. [CrossRef]
- Wrzus C, Neubauer AB. Ecological momentary assessment: a meta-analysis on designs, samples, and compliance across research fields. Assessment. Apr 2023;30(3):825-846. [CrossRef] [Medline]
- Stach M, Mulansky L, Reichert M, Pryss R, Beierle F. Call to action: investigating interaction delay in smartphone notifications. Sensors (Basel). Apr 19, 2024;24(8):2612. [CrossRef] [Medline]
- Liao Y, Skelton K, Dunton G, Bruening M. A systematic review of methods and procedures used in ecological momentary assessments of diet and physical activity research in youth: an adapted STROBE Checklist for Reporting EMA Studies (CREMAS). J Med Internet Res. Jun 21, 2016;18(6):e151. [CrossRef] [Medline]
- Diener E, Lucas RE, Oishi S. Advances and open questions in the science of subjective well-being. Collabra Psychol. 2018;4(1):15. [CrossRef] [Medline]
- Baselmans BML, van de Weijer MP, Abdellaoui A, et al. A genetic investigation of the well-being spectrum. Behav Genet. May 2019;49(3):286-297. [CrossRef] [Medline]
- Bajaj B, Pande N. Mediating role of resilience in the impact of mindfulness on life satisfaction and affect as indices of subjective well-being. Pers Individ Dif. Apr 2016;93:63-67. [CrossRef]
- Nguyen MH, Hargittai E. Digital disconnection, digital inequality, and subjective well-being: a mobile experience sampling study. J Comput Mediat Commun. Nov 8, 2023;29(1):1. [CrossRef]
- Diener E, Emmons RA, Laresen RJ, Griffin S. The satisfaction with life scale. J Pers Assess. 1985;49:71-75. [CrossRef]
- Li Z, Yin X, Jiang S, Wang M, Cai T. Psychological mechanism of subjective well-being: a stable trait or situational variability. Soc Indic Res. Sep 2014;118(2):523-534. [CrossRef]
- Jaso BA, Kraus NI, Heller AS. Identification of careless responding in ecological momentary assessment research: from posthoc analyses to real-time data monitoring. Psychol Methods. Dec 2022;27(6):958-981. [CrossRef] [Medline]
- Hasselhorn K, Ottenstein C, Lischetzke T. Modeling careless responding in ambulatory assessment studies using multilevel latent class analysis: factors influencing careless responding. Psychol Methods. May 11, 2023. [CrossRef] [Medline]
- Welling J, Fischer RL, Schinkel-Bielefeld N. Is it possible to identify careless responses with post-hoc analysis in EMA studies? Presented at: UMAP ’21: 29th ACM Conference on User Modeling, Adaptation and Personalization; Jun 21-25, 2021:150-156; Utrecht, Netherlands. [CrossRef]
- Aminikhanghahi S, Wang T, Cook DJ. Real-time change point detection with application to smart home time series data. IEEE Trans Knowl Data Eng. May 2019;31(5):1010-1023. [CrossRef] [Medline]
- Arslan RC, Reitz AK, Driebe JC, Gerlach TM, Penke L. Routinely randomize potential sources of measurement reactivity to estimate and adjust for biases in subjective reports. Psychol Methods. Apr 2021;26(2):175-185. [CrossRef] [Medline]
- Gross T, Malzhacker T. The experience sampling method and its tools: a review for developers, study administrators, and participants. Proc ACM Hum-Comput Interact. Jun 14, 2023;7(EICS):1-29. [CrossRef]
Abbreviations
| ARIMA: Autoregressive Integrated Moving Average |
| DTW: dynamic time warping |
| EMA: ecological momentary assessment |
| RR: response rate |
| STROBE CREMAS: Strengthening the Reporting of Observational Studies in Epidemiology Checklist for Reporting Ecological Momentary Assessment Studies |
Edited by Lorraine Buis; submitted 06.02.24; peer-reviewed by Kazuhiro Yoshiuchi, Randall Eckhoff, Ruediger Pryss; final revised version received 10.09.24; accepted 03.03.25; published 10.04.25.
Copyright© Diane Cook, Aiden Walker, Bryan Minor, Catherine Luna, Sarah Tomaszewski Farias, Lisa Wiese, Raven Weaver, Maureen Schmitter-Edgecombe. Originally published in JMIR mHealth and uHealth (https://mhealth.jmir.org), 10.4.2025.
This is an open-access article distributed under the terms of the Creative Commons Attribution License (https://creativecommons.org/licenses/by/4.0/), which permits unrestricted use, distribution, and reproduction in any medium, provided the original work, first published in JMIR mHealth and uHealth, is properly cited. The complete bibliographic information, a link to the original publication on https://mhealth.jmir.org/, as well as this copyright and license information must be included.