
Original Paper
Abstract
Background: Although many studies have used smartphone apps to examine alcohol consumption, none have clearly delineated long-term (>1 year) consumption among the general population.
Objective: The objective of our study is to elucidate in detail the alcohol consumption behavior of alcohol drinkers in Japan using individual real-world data. During the state of emergency associated with the COVID-19 outbreak, the government requested that people restrict social gatherings and stay at home, so we hypothesize that alcohol consumption among Japanese working people decreased during this period due to the decrease in occasions for alcohol consumption. This analysis was only possible with individual real-world data. We also aimed to clarify the effects of digital interventions based on notifications about daily alcohol consumption.
Methods: We conducted a retrospective study targeting 5-year log data from January 1, 2018, to December 31, 2022, obtained from a commercial smartphone health care app (CALO mama Plus). First, to investigate the possible size of the real-world data, we investigated the rate of active users of this commercial smartphone app. Second, to validate the individual real-world data recorded in the app, we compared individual real-world data from 9991 randomly selected users with government-provided open data on the number of daily confirmed COVID-19 cases in Japan and with nationwide alcohol consumption data. To clarify the effects of digital interventions, we investigated the relationship between 2 types of notification records (ie, “good” and “bad”) and a 3-day daily alcohol consumption log following the notification. The protocol of this retrospective study was approved by the Ethics Committee of the Kyoto University Graduate School and Faculty of Medicine (R4699).
doi:10.2196/57084
Keywords
Introduction
Alcohol consumption contributes to 3 million deaths globally each year, with harmful use responsible for 4.7% of the global burden of disease []. The World Health Organization recommends reducing harmful alcohol use by developing surveillance systems for alcohol consumption []. Although several studies using smartphone apps have been conducted [], none have examined the general population’s long-term alcohol consumption behavior, that is, for a period of time longer than a year, nor the effect of digital interventions.
To elucidate detailed alcohol consumption behavior among alcohol drinkers in Japan, we conducted a retrospective study targeting 5-year logs obtained from a commercial smartphone health care app (CALO mama Plus []; Wellmira Inc). Common drinking occasions for Japanese working people include welcome events, get-togethers, farewell parties, and regular after-work drinking parties, so we hypothesized that there was a decrease in alcohol consumption during the period of the COVID-19 outbreak and the state of emergency, when individuals were requested to stay home and reduce social gatherings. We tested this hypothesis with individual real-world data; this analysis was only possible with such data. We aimed to clarify the effects of digital interventions using notifications and daily records of alcohol consumption.
Methods
Overview
We analyzed the smartphone app logs to investigate two perspectives: (1) user numbers and (2) alcohol consumption behavior (ie, mean net alcohol consumption and alcohol-related notifications, together with their effectiveness). Because our target period coincided with the COVID-19 outbreak, we compared these values with the daily number of confirmed COVID-19 cases in Japan [].
Target Commercial Smartphone Health Care App
CALO mama Plus [] is a mobile health care app for managing nutrition. It records various health-related data, including alcohol consumption, and has been used in several health-related studies based on real-world data [-]. Details on the app can be found in .
Ethical Considerations
The dataset used in this research was collected by a service provider company for its own purposes. Legal consent for primary and secondary uses was obtained upon initial activation of the app. This retrospective study obtained no additional consent. All data were deidentified by the operating company (Wellmira Inc). The study protocol was approved by the Ethics Committee of the Kyoto University Graduate School and Faculty of Medicine (R4699).
Materials
Analysis 1 included all registered users of the target app. We calculated the rate of active users as those who input any data into the app as a proportion of the number of registered users. In other words, active users hypothetically included people who did not drink on that day and those who do not habitually drink alcohol (including nondrinkers). The rate of users inputting alcohol data was calculated as those who input alcohol consumption data to the application as a proportion of the number of registered users.
For analysis 2, we used alcohol consumption records from 9991 randomly selected users. The method for selecting target users is described in the Data Exclusion subsection. describes the background information of the users. To confirm the validity of the data, we compared individual alcohol consumption to the nationwide alcohol consumption records published by the National Tax Agency of Japan [].
| Male | Female | P value | W statistic [] | |
| Participants, n (%) | 6612 (66.2%) | 3379 (33.8%) | —a | —a |
| Age (years), mean (SD) | 52.9 (9.58) | 50.1 (10.5) | <.001 | 12.8 |
| Weight (kg), mean (SD) | 73.0 (10.9) | 57.0 (9.11) | <.001 | –104 |
| Height (m), mean (SD) | 1.72 (0.0586) | 1.59 (0.0519) | <.001 | –214 |
| BMI (kg/m2), mean (SD) | 24.8 (3.32) | 22.6 (3.36) | <.001 | –60.9 |
aNot applicable.
Analytical Conditions in Analysis 2
Data Exclusion
Initially, we randomly extracted 10,000 users who logged alcohol consumption data more than 20 times in a year for at least one calendar year from January 1, 2018, to December 31, 2022.
Considering the legal drinking age in Japan (20 years) and the average life expectancy in Japan, we excluded 7 users whose ages were 2, 3, 4, 6, 9, 18, and 123 at the time of data extraction (ie, December 31, 2022). In addition, we excluded 2 users who recorded unrealistic alcohol amounts (eg, over 1000 g net alcohol/day). Thus, the final number of target users was 9991.
Notification Evaluation
In the effectiveness evaluation of the notifications in analysis 2, the app logs for net alcohol consumption and alcohol-related notifications were analyzed to investigate whether notifications influenced drinking behavior following the notification.
We focused on 2 alcohol-related notifications derived from net alcohol intake: “good” (<20 g/day) and “bad” (≥60 g/day). We considered a notification effective when either of two conditions was satisfied: (1) at least one “no drinking day” occurred within 3 days, or (2) there were no days with ≥60 g/day within 3 days. The effectiveness rate was calculated by dividing effective notifications by the total number of notifications and multiplying by 100.
Results
Analysis 1
shows the trend of the number of app users. Although the exact number is undisclosed due to company restrictions, registered users increased 20-fold during the target period. The rate of active users and users with alcohol input data remained stable over this period, with average rates of 5.6% (SD 3.19%) and 1.17% (SD 0.689%), respectively. Compared with the number of daily confirmed COVID-19 cases in Japan (), no marked changes were confirmed in any of these values.


Analysis 2
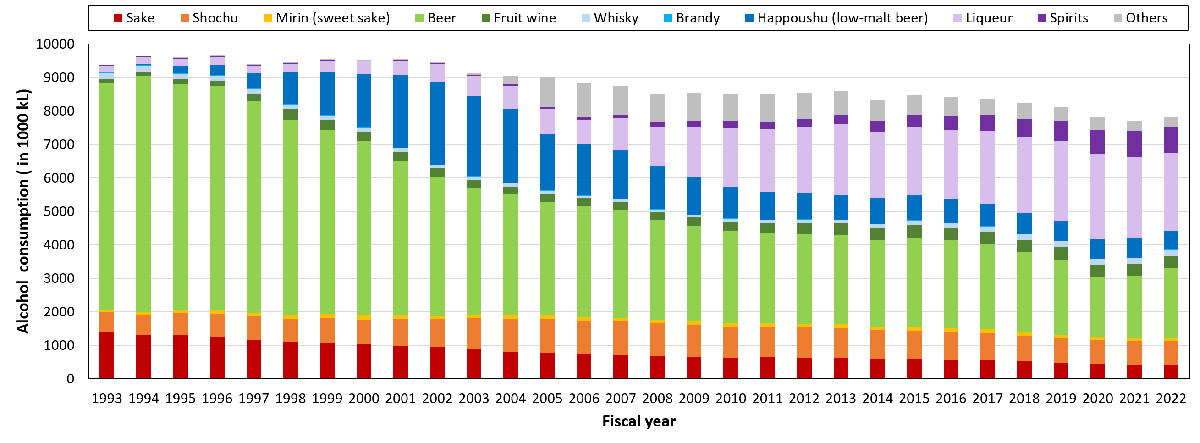
shows Japan’s alcohol consumption trends, published by the National Tax Agency of Japan []. Overall, total alcohol consumption declined, with an annual drop of about 100,000 kL after 2018. Notably, there was a decrease of 300,000 kL between 2019 and 2020, and the total alcohol consumption was similar in fiscal years 2020, 2021, and 2022. Given that fiscal years 2020 and 2021 included the state of emergency due to the COVID-19 outbreak [], this gap may reflect the government’s request to limit social gatherings.
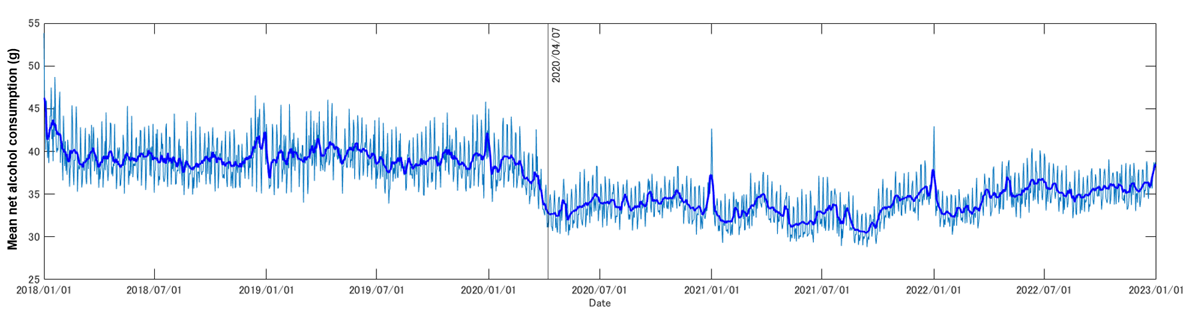
shows the trend in mean net alcohol consumption. shows the number and effectiveness of “good” notifications, whereas shows that of “bad” notifications. Notably, both mean net alcohol consumption () and the effect of “bad” alcohol-related notifications () decreased at the beginning of April 2020. Based on the Brunner-Munzel test, in the periods from January 1, 2018, to March 31, 2020, and April 1, 2020, to December 31, 2022, these differences were confirmed as significant (net alcohol consumption: W statistic=90.8; P<.001; effect of “bad” alcohol-related notifications: W statistic=34.4; P<.001). The Brunner-Munzel test results for other factors are shown in -, and other details can be found in .


Comparing “good” () and “bad” () notifications, the number of “bad” notifications was roughly double. A 2D histogram () depicts the balance between “good” (x-axis) and “bad” notifications (y-axis) for each individual. This also confirms that “bad” notifications were more common. Accordingly, target users (n=9991) were classified into four groups: (1) more “bad” than “good” (n=4180, 41.8%); (2) equal (n=369, 3.69%); (3) more “good” than “bad” (n=2787, 27.9%); and (4) no notifications (n=2655, 26.6%). In groups 1, 2, and 3, a total of 6122 (61.3%) users had <10 “bad” notifications; thus, 8777 (87.8%) of all target users had no or <10 “bad” notifications. Among the remaining 1214 (12.2%) users, 1176 (96.9%) were classified as being in group 1 (more “bad” than “good”). Thus, only specific users, such as heavy drinkers, possibly tended to receive “bad” notifications.

Discussion
Summary of Findings
We confirmed that there was a decrease in net alcohol consumption in both government-provided data () and individual real-world data () that continued after 2020, which may have been related to the outbreak of COVID-19 and the state of emergency in Japan. Regarding the effect of the digital interventions, only the “bad” notifications showed a decreased effect near the first state of emergency. Taken together, this suggests that people who only consume alcohol at social gatherings may have reduced their consumption, whereas those who originally had no interest in “bad” notifications continued their consumption.
Compared with government-provided data, the individual real-world data showed more details on alcohol consumption behavior. In all target years, we confirmed temporal peaks in mean net alcohol consumption around the year end and the New Year holiday, which might be related to the increase in drinking parties at these times. This may paradoxically support our hypothesis that the request for restricting social gatherings led to reduced alcohol consumption in Japan.
Limitations
The main limitations of this study are its generalizability and reliability. As we showed in , the 5-year rates of active app users and users who input alcohol data were both lower than 10%. This low active user rate is one of the peculiarities of real-world data, indicating that our results represent only one aspect of reality.
Another limitation is the app specifications (detailed in ). Comparing alcohol consumption and notification records, we found “good” notifications in only 4.61% of records meeting the criterion of <20 g net alcohol/day, whereas “bad” notifications were found in 27.5% of records meeting the criterion of ≥60 g net alcohol/day. Therefore, our notification analysis can be considered a pilot study, and the efficacy of notifications should be assessed independently in a prospective study with modified alert systems.
The final limitation is the influence of the COVID-19 outbreak. Because almost half of our target period included the COVID-19 outbreak, our analyses may be affected by various socioeconomic factors. Further investigation focusing on individual behavior change is required to elucidate detailed relationships.
Conclusions
A 5-year analysis of individual real-world data, including data from the COVID-19 outbreak period, showed that real-world data may reflect a more detailed reality than government-provided data.
Acknowledgments
This research was supported by JST START University Ecosystem Promotion Type (Supporting Creation of Startup Ecosystem in Startup Cities; grant JPMJST2181), Japan, and by the startup business support program IPG-Advance from the Office of Society-Academia Collaboration for Innovation (SACI), Kyoto University. This work was also supported by the research fund of the Department of Real World Data Research and Development, Graduate School of Informatics, Kyoto University, which is funded by joint research contributions from Nippon Telegraph and Telephone (NTT) Corporation, Canon Medical Systems Corporation, H.U. Group Holdings, Inc, and Ark Medical Solutions Inc to Kyoto University. The authors thank Keiko Ishimura, Shinichiro Mizuno, Ryusuke Miki, Ayako Saijo, Xie Chen, and Yuki Sasaki at Wellmira Inc for their technical support.
Data Availability
The real-world datasets on alcohol consumption analyzed during this study are not available as they are confidential business data of Wellmira Inc, but they are available from the corresponding author on reasonable request. The datasets for the number of daily confirmed COVID-19 cases in Japan are available from the Ministry of Health, Labor and Welfare in Japan [], whereas the datasets for alcohol consumption trends are available from the National Tax Agency of Japan [].
Authors' Contributions
Conceptualization: KE, T Kubota, T Koyanagi, MM
Data curation: KE, T Kubota
Formal analysis: KE
Project administration: T Koyanagi, MM
Software: KE
Visualization: KE
Writing—original draft preparation: KE
Writing—review and editing: KE, T Kubota, T Koyanagi, MM
Conflicts of Interest
KE belonged to the Department of Real World Data Research and Development, Graduate School of Informatics, Kyoto University, from July 2022 to March 2024. T Koyanagi has served as an advisor for Nippon Telegraph and Telephone Corporation (NTT), Academic Industry Research Inc, and Kyoto University Innovation Capital Co, Ltd. Additionally, he holds leadership and advisory positions, including serving as the representative director of the General Incorporated Association LSP, chairperson of the Non-Profit Organization Kyoto Commons, member of the Selection Committee for the Japan Medical Research and Development Grand Prize, member of the Project Evaluation Committee at the Japan Agency for Medical Research and Development (AMED), member of the Researcher Support and Grant Selection Committee at the Japan Pharmaceutical Manufacturers Association (JPMA), and member of the Scholarship Selection Committee at the Shuto Scholarship Foundation. These affiliations have not influenced the content or conclusions of this manuscript.
Supplementary remarks and analysis.
DOCX File , 22 KBReferences
- Alcohol. World Health Organization. URL: https://www.who.int/health-topics/alcohol [accessed 2025-03-04]
- Infographic: alcohol and health. World Health Organization. URL: https://www.who.int/images/default-source/departments/substances-abuse/alcohol/infographics/alcohol-3-million-death-every-year.png?sfvrsn=8062967_2 [accessed 2025-03-04]
- Colbert S, Thornton L, Richmond R. Smartphone apps for managing alcohol consumption: a literature review. Addict Sci Clin Pract. May 07, 2020;15(1):17. [FREE Full text] [CrossRef] [Medline]
- CALO Mama Plus. Wellmira Inc. URL: https://calomama.com/ [accessed 2025-03-04]
- Open data on COVID-19. Ministry of Health, Labour and Welfare. URL: https://www.mhlw.go.jp/stf/covid-19/open-data.html [accessed 2025-03-04]
- Sato K, Sakata R, Murayama C, Yamaguchi M, Matsuoka Y, Kondo N. Changes in work and life patterns associated with depressive symptoms during the COVID-19 pandemic: an observational study of health app (CALO Mama) users. Occup Environ Med. Sep 2021;78(9):632-637. [FREE Full text] [CrossRef] [Medline]
- Sasaki Y, Sato K, Kobayashi S, Asakura K. Nutrient and food group prediction as orchestrated by an automated image recognition system in a smartphone app (CALO mama): validation study. JMIR Form Res. Jan 10, 2022;6(1):e31875. [FREE Full text] [CrossRef] [Medline]
- Nakata Y, Sasai H, Gosho M, Kobayashi H, Shi Y, Ohigashi T, et al. A smartphone healthcare application, CALO mama Plus, to promote weight loss: a randomized controlled trial. Nutrients. Nov 02, 2022;14(21):4608. [FREE Full text] [CrossRef] [Medline]
- Eguchi A, Kawamura Y, Kawashima T, Ghaznavi C, Ishimura K, Kohsaka S, et al. The efficacy of an mHealth app in facilitating weight loss among Japanese fitness center members: regression analysis study. JMIR Form Res. Nov 08, 2023;7:e48435. [FREE Full text] [CrossRef] [Medline]
- Alcohol guidebook (June 2024). National Tax Agency Japan. URL: https://www.nta.go.jp/taxes/sake/shiori-gaikyo/shiori/2024/index.htm [accessed 2025-03-04]
- scipy.stats. brunnermunzel. SciPy. URL: https://docs.scipy.org/doc/scipy/reference/generated/scipy.stats.brunnermunzel.html [accessed 2025-03-10]
- Transition of the state of emergency for COVID-19. Digital Agency Japan. URL: https://hakusyo1.moj.go.jp/jp/69/nfm/n69_2_7_2_0_3.html [accessed 2025-03-04]
Edited by E Mensah; submitted 05.02.24; peer-reviewed by T Takemura, K Aguiar; comments to author 05.03.24; revised version received 13.05.24; accepted 26.02.25; published 25.03.25.
Copyright©Kana Eguchi, Takeaki Kubota, Tomoyoshi Koyanagi, Manabu Muto. Originally published in the Online Journal of Public Health Informatics (https://ojphi.jmir.org/), 25.03.2025.
This is an open-access article distributed under the terms of the Creative Commons Attribution License (https://creativecommons.org/licenses/by/4.0/), which permits unrestricted use, distribution, and reproduction in any medium, provided the original work, first published in the Online Journal of Public Health Informatics, is properly cited. The complete bibliographic information, a link to the original publication on https://ojphi.jmir.org/, as well as this copyright and license information must be included.