Analysis of Variance (ANOVA) is a statistical technique used to determine if there are significant differences between the average values (means) of two or more independent groups. It works by examining the spread of data within each group compared to the spread between the groups, helping researchers understand if observed differences are likely real or just due to random chance. It is widely used in research, including medicine, to compare treatments, interventions, or conditions.

Problem Statement: Medical Example
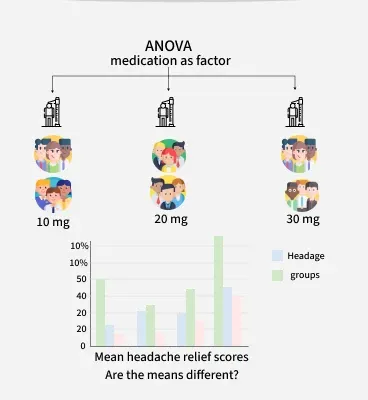
Suppose a doctor wants to test the effectiveness of a new headache medication at three different dosages: 10 mg, 20 mg, and 30 mg. Patients rate their headache relief on a scale of 1 to 10 (1 = no relief, 10 = complete relief). The goal is to determine if the mean relief scores differ significantly between the three dosage groups.
- Factor (Independent Variable): Medication dosage
- Levels: 10 mg, 20 mg, 30 mg
- Dependent Variable: Headache relief score (1–10)
The formula of ANOVA revolves around calculating an F-statistic (or F-ratio). This F-statistic is essentially a ratio that compares the variability between your groups to the variability within your groups.

Assumptions of ANOVA
ANOVA relies on several key assumptions to ensure valid results:
- Normality: The data within each group should be normally distributed.
- Homogeneity of Variance: The variance among the groups should be approximately equal.
- Independence: Observations must be independent of each other.
- Randomness: The sample should be randomly selected.
Types of ANOVA
One-Way ANOVA
- Purpose: One-Way ANOVA Tests the effect of a single factor (e.g., medication dosage) on a dependent variable.
- Example: Comparing mean headache relief scores across 10 mg, 20 mg, and 30 mg groups.
Two-Way ANOVA
- Purpose: Two-Way ANOVA Tests the effects of two factors (e.g., medication dosage and patient gender) and their interaction.
- Example: Investigating whether both dosage and gender (male/female) affect headache relief, and if there’s an interaction between them.
ANOVA Explained with the Medical Example
Sample Data Table
Patient | 10 mg | 20 mg | 30 mg |
|---|---|---|---|
1 | 4 | 6 | 8 |
2 | 5 | 7 | 7 |
3 | 3 | 5 | 9 |
4 | 4 | 6 | 8 |
5 | 4 | 7 | 8 |
Group means:
- 10 mg:
\bar{X}_{10} = 4.0 - 20 mg:
\bar{X}_{20} = 6.2 - 30 mg:
\bar{X}_{30} = 8.0 - Grand mean:
\bar{X}_{T} = 6.07
Step-by-Step ANOVA Calculation
1. Calculate Sum of Squares
- Between Groups (SSB):
SSB = \sum n_j \left( \overline{X}_j - \overline{X}_T \right)^2 - 10 mg:
5 \times (4.0 - 6.07)^2 = 21.42 - 20 mg:
5 \times (6.2 - 6.07)^2 = 0.08 - 30 mg:
5 \times (8.0 - 6.07)^2 = 18.62 - Within Groups (SSW):
SSW = \sum \sum (X - \overline{X}_j)^2 - 10 mg: 2.0
- 20 mg: 2.8
- 30 mg: 2.0
- Total SSW = 6.8
- 10 mg:
- Total Sum of Squares (SST):
SST = SSB + SSW = 46.92
2. Degrees of Freedom
- Degree of freedom between groups:
k - 1 = 2 - Within groups:
N - k = 12 - Total:
N - 1 = 14
3. Mean Squares
- Between groups:
MSB = \frac{SSB}{df_{b}} = 20.06 - Within groups:
MSW = \frac{SSW}{df_{W}} = 0.57
4. F-Statistic
F-statistic
5. ANOVA Table
Source | SS | df | MS | F |
|---|---|---|---|---|
Between | 40.12 | 2 | 20.06 | 35.19 |
Within | 6.8 | 12 | 0.57 | |
Total | 46.92 | 14 |
6. F-Distribution and Significance
- Critical F-value (α = 0.05, dfB = 2, dfW = 12): 3.89 (from F-table).
- Since calculated F = 35.19 > 3.89, we reject H₀.
- Conclusion: Dosage significantly affects headache relief
F(2,12) = 35.19, \; p < 0.05
One-Way vs Two-Way ANOVA
Feature | One-Way ANOVA | Two-Way ANOVA |
|---|---|---|
Factors (IVs) | 1 (e.g., dosage) | 2 (e.g., dosage, gender) |
Interaction Tested | No | Yes |
Example | Dosage only | Dosage and gender |
Main Purpose | Group mean differences | Main and interaction effects |
Applications of ANOVA
- Medicine: Comparing drug dosages, treatment methods, or patient groups.
- Education: Evaluating teaching methods.
- Market Research: Testing product preferences.
- Biology, Psychology, Economics: Comparing interventions, treatments, or strategies.
Advantages of ANOVA
- Simultaneous Comparison: Tests multiple groups at once, reducing Type I error risk.
- Interaction Testing: Two-way ANOVA reveals how factors jointly affect outcomes.
- Efficiency: More efficient than multiple t-tests.
- Flexibility: Handles different data types and experimental designs.
- Robustness: Tolerant to minor violations of assumptions.