Beehaw
  • Communities
  • Create Post
  • search
    Search
  • Login
  • Sign Up
Bloodyashes ( Bloodyashes@lemm.ee )  to Data Is Beautiful@lemmy.ml · 3 years ago

Global oil production in 2022

i.imgur.com

external-link
message-square
7
link
fedilink
64
external-link

Global oil production in 2022

i.imgur.com

Bloodyashes ( Bloodyashes@lemm.ee )  to Data Is Beautiful@lemmy.ml · 3 years ago
message-square
7
link
fedilink
alert-triangle
You must log in or # to comment.
  • infeeeee ( infeeeee@lemm.ee ) 
    link
    fedilink
    arrow-up
    21
    ·
    3 years ago

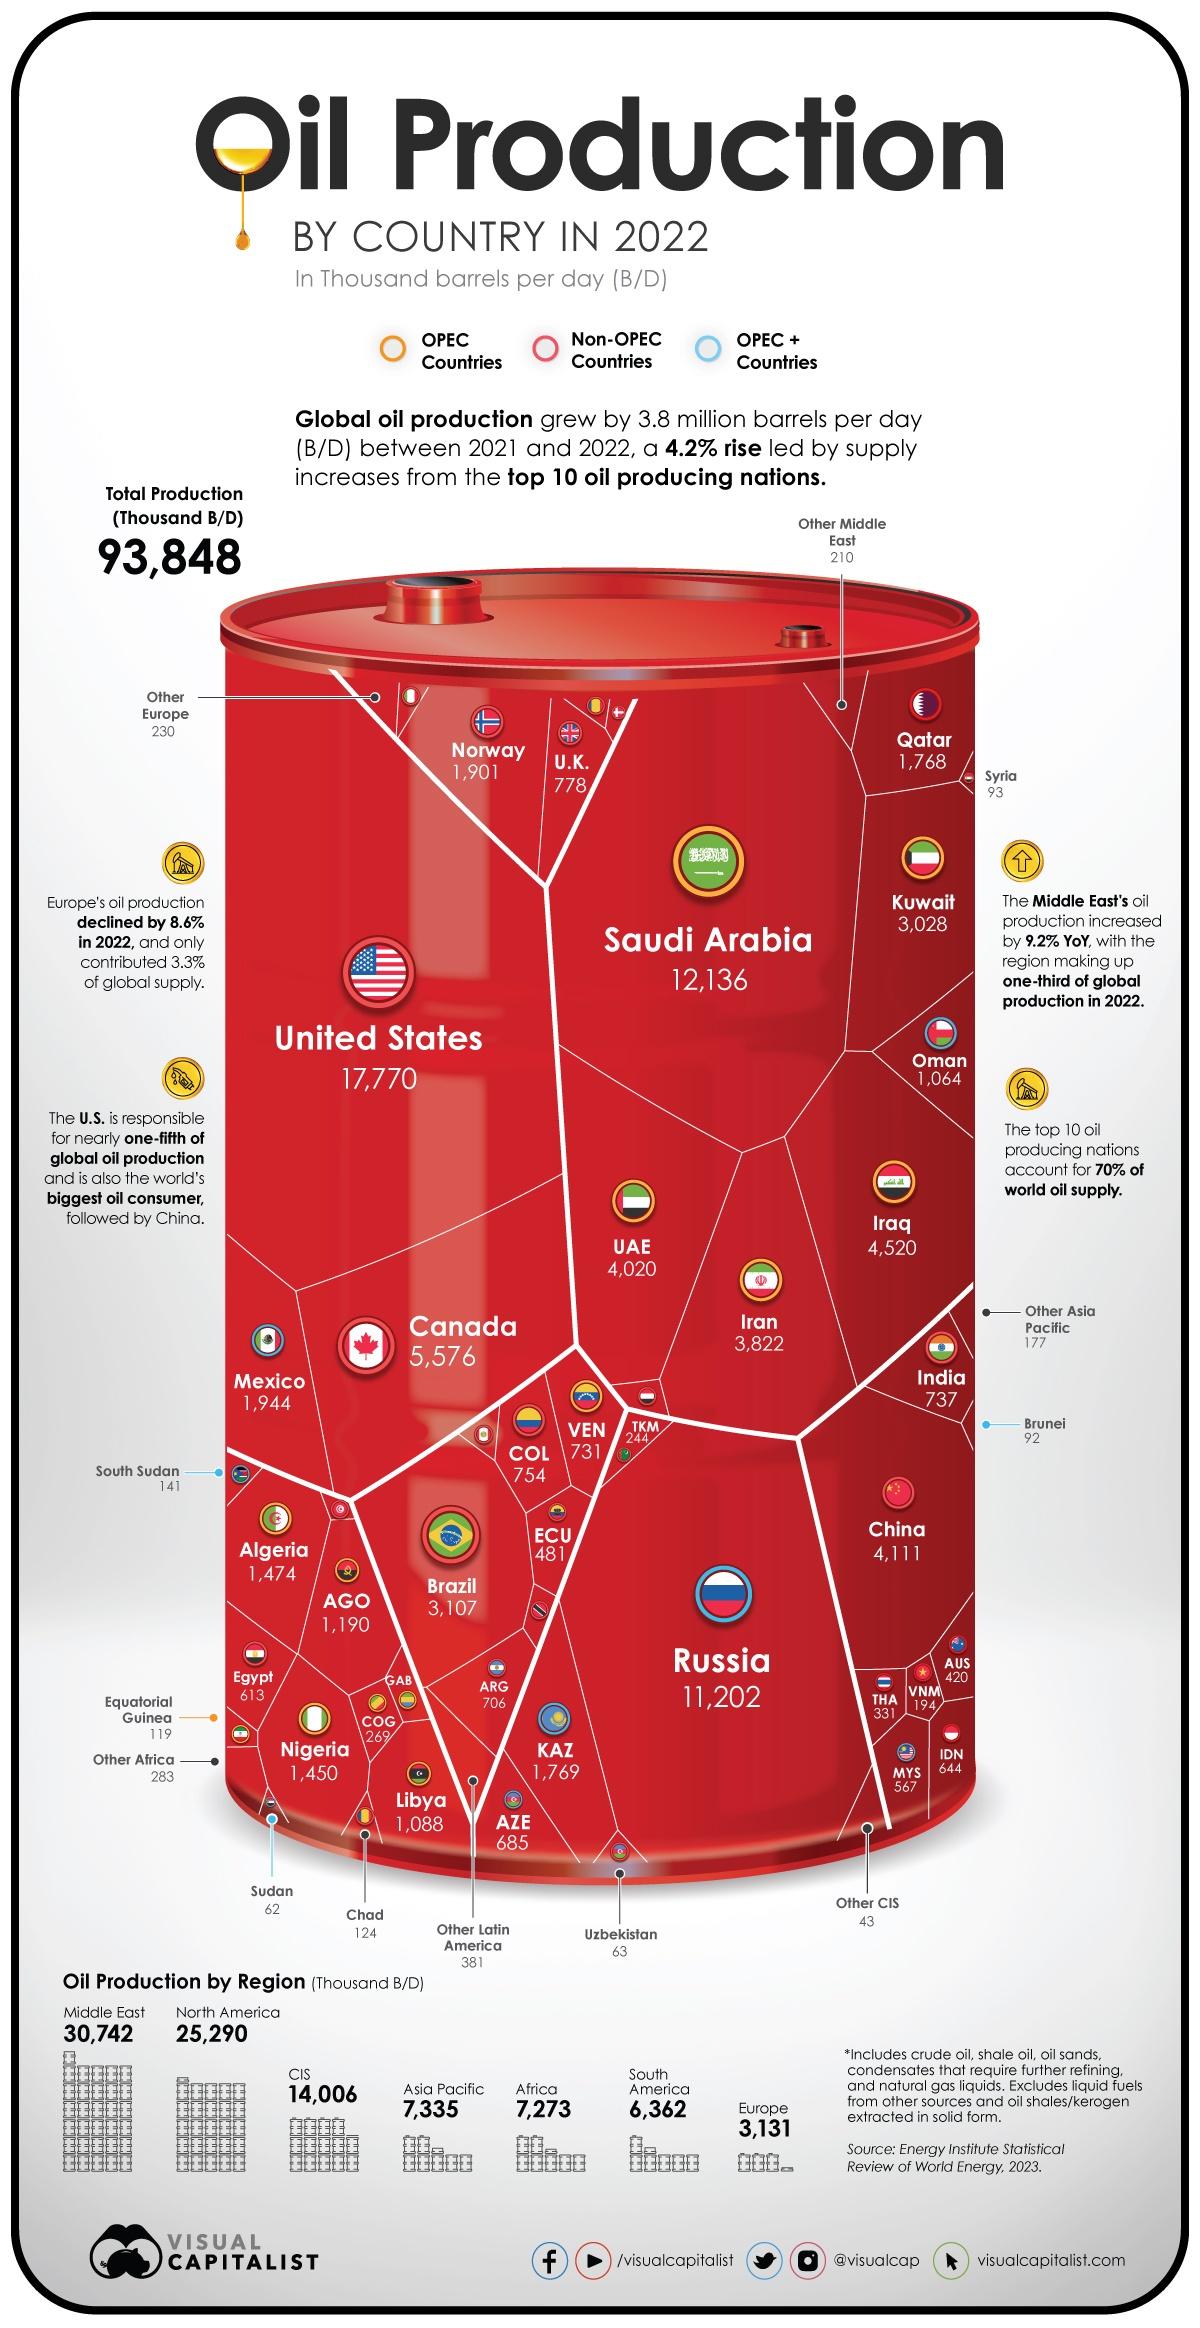
    I hate this graphic. Should we consider the 3rd dimension as well? I mean, the “thickness” of the barrel is much bigger behind e.g. UAE than Oman. From the numbers it seems we shouldn’t.

    But the boundary follows the arc on the top and bottom, so it’s definetily projected to the half surface of a cilynder, but the voronoi lines are straight, but they should curve just like the top and bottom.

    • socsa ( socsa@lemmy.ml ) Banned
      link
      fedilink
      arrow-up
      9
      ·
      3 years ago

      I would be legitimately impressed if the data is scaled based on the volume of the implied cylindrical section defined by that surface border, if only because that’s a pretty annoying calculation to make.

    • xvlc ( xvlc@feddit.de ) 
      link
      fedilink
      arrow-up
      2
      ·
      3 years ago

      Also, what about the back side of the barrel? Who is producing that oil?

  • Vent ( Vent@lemm.ee ) 
    link
    fedilink
    arrow-up
    13
    ·
    3 years ago

    Data is beautiful impossible to interpret

  • nieceandtows ( nieceandtows@programming.dev ) 
    link
    fedilink
    arrow-up
    4
    ·
    3 years ago

    That’s an interesting type of visualization. Is there a name for this type?

    • Ms. ArmoredThirteen ( ArmoredThirteen@lemmy.ml ) 
      link
      fedilink
      arrow-up
      4
      ·
      3 years ago

      It looks kinda like a Voronoi diagram but as far as I know those don’t really do specified areas/volumes for a cell.

    • beq ( beq@feddit.ch ) 
      link
      fedilink
      arrow-up
      2
      ·
      3 years ago

      Barrel chart

Data Is Beautiful@lemmy.ml

dataisbeautiful@lemmy.ml

Subscribe from Remote Instance

Create a post
You are not logged in. However you can subscribe from another Fediverse account, for example Lemmy or Mastodon. To do this, paste the following into the search field of your instance: !dataisbeautiful@lemmy.ml

A place to share and discuss data visualizations. #dataviz

Visibility: Public
globe

This community can be federated to other instances and be posted/commented in by their users.

  • 8 users / day
  • 9 users / week
  • 10 users / month
  • 444 users / 6 months
  • 166 local subscribers
  • 9.96K subscribers
  • 140 Posts
  • 1.14K Comments
  • Modlog
  • mods:
  • sátur ( satur@lemmy.ml ) 
  • Otter ( otter@lemmy.ca ) 
  • Cirrokumulus ( cirrokumulus@slrpnk.net ) 
  • Qaz ( Qaz@lemmy.ml ) 
  • BE: 0.19.15
  • Modlog
  • Legal
  • Instances
  • Docs
  • Code