The Phantom Yield

Why national crop statistics measure the standing plant and the harvested grain as if they were the same thing

The cleanest square metre in the field
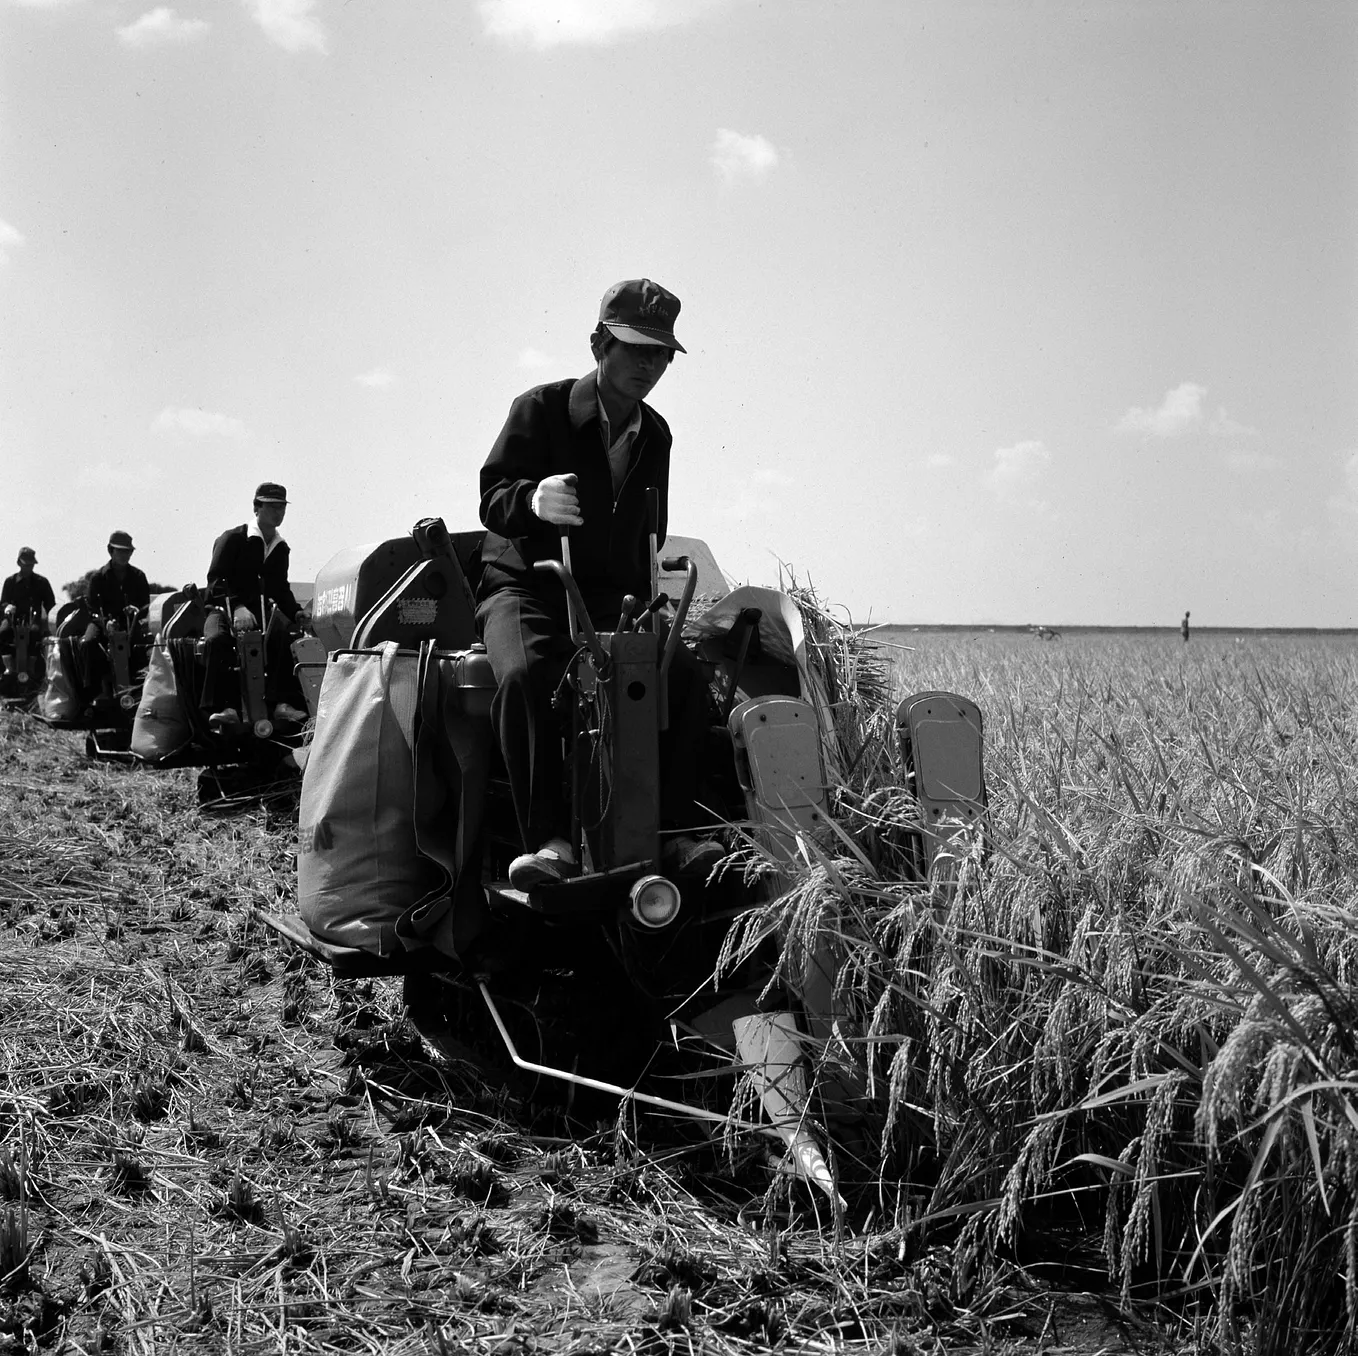
It happens on a morning in late November, in a rice block outside Boudh town in Odisha, and it takes about forty minutes.
A revenue inspector and two enumerators arrive with a folding aluminium frame, a length of nylon rope, and a spring balance. The frame marks five metres by five metres. They walk into a standing paddy field, pick a spot roughly a third of the way in from the bund, drop the frame, and cut everything inside it by hand. Not swung fast the way a labourer would swing it, but slowly, carefully, the way you cut something you intend to weigh. Then they thresh it on a mat, winnow it, bag it, and hang the bag from the spring balance. The number goes into a register. That number, divided by twenty-five square metres and multiplied out, becomes the yield of this block. Then, through steps nobody in the field checks, it becomes the yield of the district, the state, and the country.
I have watched this done more times than I can count, and the thing I keep coming back to is not the arithmetic. It is how gently they cut.
That twenty-five square metres is, almost without exception, the best-harvested patch of rice in the entire field. Nobody spills a bundle. Nobody leaves a stray panicle lying on the bund. Nobody rushes because the sky has turned and the grain is sitting at 24 percent moisture and needs to be off the field by Thursday. Nobody is waiting for a machine that is three villages away, booked solid for two more days. The sample is harvested the way a harvest would go if nothing went wrong.
Then the result is multiplied by ten thousand.

Two yields, one number
Agronomists have vocabulary for this, and it is more honest than the policy debate that uses the numbers. What the crop-cut sample measures is called biological yield: the grain the plant produced. What the farmer sells, eats, stores, and repays the loan with is economic yield: what survives the walk from standing panicle to bin.
The standard methods chapter on yield estimation in smallholder systems, published in the CCAFS measurement methods volume, puts the distinction without decoration. Crop cut, it says, “only estimates biological yield without taking into account postharvest losses and is therefore unable to estimate economic yield, which is of most interest to farmers.”
Read that once more. The method most of the world uses to decide how much food it produces is documented, by its own practitioners, as measuring something other than the thing farmers care about. This is not a scandal anybody hid. It sits in a methods chapter, in plain sight, and then it is set aside, because there is no other number and the number is needed by Thursday.
Call the difference the phantom yield. It is grain that exists in the national estimate and in no granary. It is produced, counted, reported, graphed, compared against last year, and never eaten by anybody.
I want to be careful with the framing, because it can slide into something silly if pushed too far. Nobody is claiming statisticians are fools or that the numbers are invented. Crop cutting is the best tool available at the scale and budget it is deployed on, and the people doing it in the mud take it seriously. The problem is structural. The tool answers a question, and the question it answers is not the one the number gets used for.
How wide the gap runs

This is where the literature becomes uncomfortable, because the comparisons that exist are not flattering.
A review of yield estimation methods for smallholder systems, drawing on work across five African countries, found crop-cut estimates running on average 30 percent above farmer-reported production. The same review cites a Bangladesh study in which even well-trained enumerators produced crop-cut estimates 20 percent above actual yield. A separate IFPRI survey of the method’s error sources puts the overestimate at 37 to 86 percent relative to farmer estimates, and 14 to 38 percent relative to whole-plot harvest, which is the closest thing to ground truth anyone has got.
Those ranges are wide enough that I would not build a policy on any single one. But they all point the same direction, and the direction matters more than the decimal.
The FAO’s field test in Ghana is the cleanest illustration I know, because it ran both methods on the same households in the same season. Farmer declarations for maize came to 1.0 tonnes per hectare. Objective crop-cut measurement on the same crop came to 2.3 tonnes per hectare. Depending on which number you used, maize moved from lowest-yielding to highest-yielding in the crop ranking. The report is careful here; it notes that part of the gap may be farmers misjudging their plot areas, and it declines to declare either figure the truth. What it demonstrates is that the two numbers describe two different objects.
One is a plant. One is a harvest.
The harvest window, and what closes it
Here is the part that turns a measurement quibble into a real economic loss.
Grain does not wait. Once a rice crop passes its optimum moisture window, somewhere between 21 and 24 percent, losses start accumulating on a clock the farmer does not control. The FAO’s rice post-harvest operations manual says it in one flat sentence: delayed harvesting exposes the crop to insect, rodent and bird pests, in addition to increased risks of lodging and grain shattering.
The CORIGAP synthesis puts a number on the shattering alone, at more than 5 percent of grain lost to delays past maturity. It also notes that wet paddy drying delayed beyond 24 hours costs up to 1 percent a day in quality, through discoloration, mould and broken grains. In Myanmar, where cut rice plants are commonly stacked in the field to dry before threshing, documented losses run as high as 40 percent.
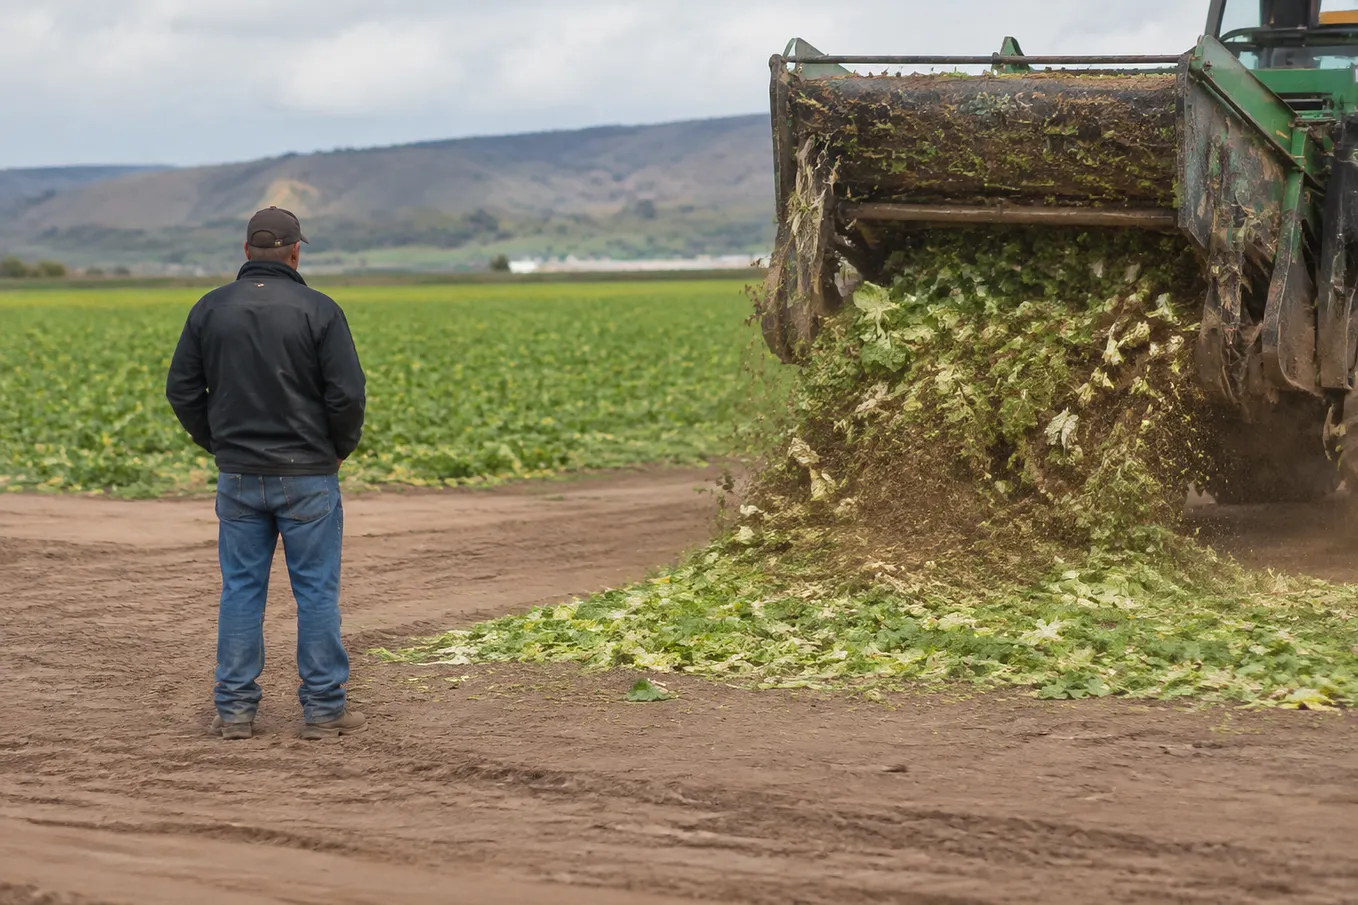
Forty percent. In the field. Before the grain has touched a truck.
Then there is the drying constraint, which is the one that surprises people. Maize comes off the field in much of sub-Saharan Africa at 19 to 25 percent moisture and needs to reach 13 percent or below for safe storage. The recommended window for getting it under 15 percent is 24 to 48 hours. In practice, smallholders without mechanical drying watch the calendar instead of the moisture meter, and the aflatoxin literature is blunt about where that ends: contamination can increase tenfold within three days when high-moisture maize is stored.
The CORIGAP authors make the point directly: cutting time must be closely linked with threshing and drying capabilities. That sentence is the whole argument. Cutting time is not an agronomic decision. It is a logistics decision wearing an agronomic costume.
Get Wishope’s stories in your inbox
Join Medium for free to get updates from this writer.
And logistics, across most of the smallholder world, comes down to one thing: whether there is a machine, and whether it can get to your field this week.

Why nothing corrects it
Standard economics says a real cost eventually shows up in a price. It does not here, and I think three things stop it.
The number has a job. Yield estimates feed procurement, minimum support price, export planning, food security dashboards, and the national accounts. Every one of those institutions is better served by a bigger number, and the crop-cut method reliably delivers one. Nobody’s career advances on discovering that a decade of production growth was partly a measurement artefact.
The loss has no witness. A kidney failing in a clinic is an event. Somebody files a claim, buys a prescription, misses a week of work. Grain shattered into a puddle is not an event. It leaves no paperwork, no diagnosis, no bill. It simply fails to arrive, and absence is very hard to count.
It happens in the seam. Crop cutting happens at a defined point in the crop calendar. Harvest losses happen after the estimate is filed and before the next season’s baseline is drawn. They fall between two reporting periods, so no single year owns them.
Which leaves the global yield gap enterprise resting on a denominator that already contains the loss. The Global Yield Gap Atlas and its successor define the gap as simulated yield potential minus average actual farm yield, and their own protocol for sourcing actual yields recommends national statistics first and farm surveys second. The protocol also warns, in as many words, that “large discrepancies between official yield statistics and independent yield measurements have been found in African countries,” and recommends validating national statistics against independent sources wherever possible.
That warning is the tell. If actual yields are biased upward, then the gap between potential and actual is biased downward. We are not measuring how much food the world fails to grow. We are measuring how much it fails to grow, minus how much it grows and then drops on the ground.

The same ledger, three continents
Put the known magnitudes side by side and they stop looking like separate regional problems.
In sub-Saharan Africa, the FAO and World Bank’s Missing Food assessment valued post-harvest grain losses at around 4 billion US dollars a year, against annual grain production worth about 27 billion. The African Postharvest Losses Information System puts physical grain losses before processing at 10 to 20 percent. For eastern and southern Africa alone, losses were valued at 1.6 billion dollars a year, roughly 13.5 percent of the value of grain produced.
In Ghana, the FAO field test put measured harvest and post-harvest losses at 2.9 percent for sorghum and 9.5 percent for maize, with the wetter of the two districts losing more across every crop.
In Nigeria, work cited in a review of rice harvest losses estimated that grain lost between production and milling wastes 2.1 million cubic metres of water, half a million hectares of land, and about 650,000 tonnes of carbon dioxide equivalent every year. In Myanmar, the same review reports losses from reaping to milling raising per-hectare greenhouse gas emissions by 30 to 50 percent.
In China, where mechanisation runs far ahead of anywhere else in the smallholder world, the Ministry of Agriculture and Rural Affairs put combine harvest losses at 3 to 5 percent against roughly 10 percent for manual harvesting, at a point when 97 percent of wheat, 94 percent of rice and 78 percent of maize was machine-harvested. County figures collected under the same national loss-reduction programme run consistent with that direction: Weixin county in Yunnan reported machine losses under 2 percent against 5 to 7 percent by hand; Shiqian county in Guizhou reported 2 to 4 percent against 8 to 9 percent.
Sit with those last two, because they invert the intuition most people bring. Mechanisation was supposed to be about labour. Faster, cheaper, fewer backs. What the loss data keeps showing is that the machine is also an instrument for compressing time: it shortens the interval between ripe and safe from two weeks to an afternoon, and most of the grain you keep is grain you got out before the rain.

Machines are not magic, and fit is everything
I do not want to oversell this, and there is a version of the mechanisation story that deserves the scepticism it gets.
A combine is not a universal solvent for harvest loss. The rice harvest loss literature is explicit that outcomes depend on the machine, the operator, the field, and the timing, and that losses shift with variety, season, and farm size. High-yielding varieties can lose more than local landraces, because thin husks crack and there is simply more grain to spill. In India, some studies found larger farms losing more per unit area than small ones, reversing the pattern seen in China and Bangladesh. Brazilian soybean growers have been documented deliberately running combines faster than optimal, accepting higher losses, because clearing the first crop early protects the second one.
That last example is worth holding onto. Those farmers are not unaware of the losses. They are trading grain for calendar, and the trade is rational. Which is exactly the point being made here: harvest loss is not a failure of skill or knowledge. It is the price of a constraint.
This is also where specification sheets stop being boring. Whether a machine fits a given field comes down to a short list of variables: cutting width, ground pressure, threshing and separation configuration, and whether the machine was built for wet paddy or dry standing wheat. A half-feed machine behaves differently from a full-feed one, and a crawler undercarriage behaves differently from wheels on ground that has just been rained on. Manufacturer specification pages, such as the model listings indexed on iharvester, are where those variables get written down, and they are worth reading before anyone concludes that buying a machine will solve a harvest-timing problem.
Because sometimes it will. And sometimes the problem was never the harvester. It was that there is nowhere to dry forty tonnes of paddy in November.
Two departments, two units
The reason this persists is boring and institutional.
Crop estimation sits with revenue and statistics. Harvest loss sits with agricultural engineering and post-harvest management. The first produces a figure in tonnes per hectare, on an annual cycle, and it feeds the budget. The second produces percentages and parts per billion, in project reports, and it feeds nobody’s headline.
So one department measures the crop at the moment it is standing, and another worries about what happens to it afterwards, and neither is accountable for the distance between them. The statistics side celebrates a record harvest. The extension side runs a training on loss reduction. Neither has to reconcile with the other, and the reconciling number, the one the household actually lives on, is produced by neither.
I have sat in meetings where both sets of figures were on the table and nobody noticed they were describing different objects. That is not malice. It is what happens when one field is measured by two institutions using two units, and one of them reports to the finance ministry.
Back to the square metre
The enumerators fold up the frame, coil the rope, and walk to the next field. The farmer goes back to waiting for a machine that is due the day after tomorrow, while the grain sits at 22 percent and the sky does something unhelpful.
That sample was not a lie. It was twenty-five square metres of rice, harvested under conditions no farmer in that block would recognise, then multiplied until it hardened into a national fact. The arithmetic is sound. What is wrong is the assumption smuggled in at the start: that the field harvests as well as the sample does.
The farmer’s neighbour, whose plot was cut by machine three days ago because he booked early and paid cash, will report roughly the same yield. He will sell more rice. Nobody will write down why.
That difference, not the seed, not the fertiliser, not the rainfall, is the phantom yield. It is the portion of the harvest we have been counting as grown and never bothered to check arrived.