Linear Regression
Linear Regression is a fundamental statistical and supervised machine-learning technique used to understand, model, and predict the relationship between variables. According to the given definition, it works by identifying how a dependent variable (the value we want to predict) changes in response to one or more independent variables (the predictors or input features).
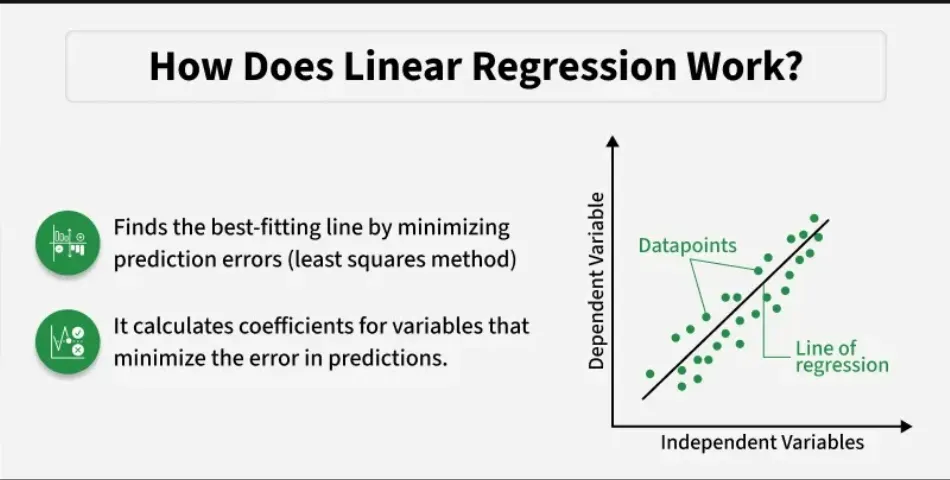
In linear regression, the algorithm learns from a labeled dataset, meaning the input variables and their corresponding output values are already known. Using this data, it fits the best possible straight line (or a hyperplane in the case of multiple variables) that represents the relationship between the inputs and the output. This line is chosen in such a way that the overall prediction error is minimized, making the model as accurate as possible.
The relationship is expressed mathematically using an equation such as:
Y = Intercept + (Slope × X)
Here, the intercept represents the value of the dependent variable when the independent variable is zero, while the slope indicates how much the dependent variable changes for a one-unit change in the independent variable. This makes the model highly interpretable, as each parameter clearly shows the impact of the input on the output.
Linear regression assumes that there is a linear relationship between the input and output variables. This means that as the input increases or decreases, the output changes at a constant rate, forming a straight-line pattern. Because of this assumption, linear regression works best when the data follows a linear trend.
Due to its simplicity, clarity, and efficiency, linear regression is widely used for prediction and trend analysis in many fields. For example, it can be used to predict house prices based on size, forecast sales, analyze economic trends, or understand relationships between variables. Its ability to clearly explain how predictions are made makes it one of the most commonly used and foundational algorithms in machine learning and statistics.

How Linear Regression Works (Simple Linear Regression)
1. Identifying Variables
- Dependent Variable (Y): The output value that we want to predict
Example: Blood Pressure. - Independent Variable (X): The input value used to make predictions
Example: Hours Exercised
2. Plotting the Data
The data points are plotted on a graph using a scatter plot, where:
- X values are placed on the horizontal axis
- Y values are placed on the vertical axis
This helps visualize the relationship between X and Y and see whether a linear trend exists.
3. Finding the Line of Best Fit
The main goal of linear regression is to find a best-fit line, which is the straight line that most accurately represents the relationship between X and Y. This line minimizes the total difference between the actual data points and the predicted values generated by the model.
Equation of the Best-Fit Line
For simple linear regression, the best-fit line is represented by the equation:
y= mx + b
Where:
- y is the predicted value (dependent variable)
- x is the independent variable
- m is the slope of the line
- b is the intercept
The values of m (slope) and b (intercept) are optimized so that the predicted values are as close as possible to the actual data points.
Goal of the Best-Fit Line
The goal of the best-fit line is to minimize prediction errors. This allows the model to:
- Accurately represent the relationship between X and Y
- Predict the dependent variable for new, unseen input values

Minimizing Error: Least Squares Method
To find the best-fit line, linear regression uses the Least Squares Method. This method minimizes the sum of squared errors (SSE) between the actual values and predicted values.
Residual
A residual is the difference between an actual value and a predicted value:
Residual = yi − y^i
Where:
- yi is the actual observed value
- y^i is the predicted value
Sum of Squared Errors (SSE)
SSE=∑(yi−y^i)2
Get Shakeraafreen’s stories in your inbox
Join Medium for free to get updates from this writer.
By squaring the residuals and summing them, the method ensures that:
- All errors are positive
- Larger errors are penalized more heavily
The line with the minimum SSE is selected as the best-fit line.
Interpretation of the Best-Fit Line
- Slope (m): Indicates how much the dependent variable (Y) changes for every one-unit change in the independent variable (X).
Example: If the slope is 5, Y increases by 5 units when X increases by 1 unit. - Intercept (b): Represents the predicted value of Y when X equals zero. It shows where the line crosses the Y-axis.
Types of Linear Regression
Linear regression can be classified based on the number of independent variables (features) used to predict the dependent variable.
- When there is only one independent feature, it is called Simple Linear Regression (also known as Univariate Linear Regression).
- When there are two or more independent features, it is called Multiple Linear Regression (also known as Multivariate Linear Regression).
1. Simple Linear Regression
Simple linear regression is used when we want to predict a target value (dependent variable) using only one input feature (independent variable). It assumes a straight-line relationship between the input and output variables.
Formula

Where:
- y^ is the predicted value
- x is the independent variable (input feature)
- θ0 is the intercept (value of y^\hat{y}y^ when x = 0)
- θ1x is the slope or coefficient (how much y^\hat{y}y^ changes for a one-unit change in x)
2. Multiple Linear Regression
Multiple linear regression is used when the dependent variable is predicted using more than one independent variable. It helps model more complex relationships where multiple factors influence the output.
Formula

The goal of multiple linear regression is to find the best-fit line (or plane) that predicts the dependent variable accurately for given input values.
Use Cases of Linear Regression
- Real Estate: Predict property prices using location, size, and other factors
- Finance: Forecast stock prices using interest rates and inflation data
- Agriculture: Estimate crop yield using rainfall, temperature, and soil quality
- E-commerce: Analyze how price, promotions, and seasons affect sales
Once linear regression and its types are understood, the next step is to build and train the model using optimization techniques.
Cost Function for Linear Regression
In linear regression, the cost function measures how far the predicted values (Y^\hat{Y}Y^) are from the actual values (Y). It helps quantify the model’s error and guides the learning process to find the best-fit line.
The most commonly used cost function is Mean Squared Error (MSE).
Cost Function Formula

Advantages of Linear Regression
- Simple and Easy to Understand
Linear regression is easy to learn and interpret. The relationship between variables is represented using a straight line, making results straightforward to explain. - Computationally Efficient
It requires less computational power compared to complex machine-learning algorithms, so it works well even with large datasets. - Easy Interpretation of Results
The coefficients clearly show how each independent variable affects the dependent variable, which helps in understanding variable importance. - Good for Prediction and Trend Analysis
Linear regression performs well when there is a linear relationship and is useful for forecasting and trend identification. - Widely Applicable
It is commonly used across fields such as finance, healthcare, economics, agriculture, and business analytics.
Limitations of Linear Regression
- Assumes Linear Relationship
Linear regression works only when the relationship between variables is linear. It performs poorly if the relationship is non-linear. - Sensitive to Outliers
Extreme values can significantly affect the slope and intercept, leading to inaccurate predictions. - Affected by Multicollinearity
In multiple linear regression, highly correlated independent variables can reduce the reliability of coefficient estimates. - Assumes Constant Variance of Errors
If the variance of errors changes across values of the independent variable, model performance can degrade. - Limited to Numeric Data
Linear regression mainly works with numerical features and often requires extra processing for categorical data.