PinnedInData Storytelling CornerbyJohn Loewen, PhD·Jul 9, 20254 Simple Data Storytelling Methods That Will Make You A HeroExploring Alberto Cairo’s ideas on choosing the right data viz toolsA response icon24A response icon24
PinnedInBouncin’ and Behavin’ BlogsbyJohn Loewen, PhD·Dec 15, 2023I Bought a One Way Ticket to Nowhere— And Met My Wife!Sometimes risk in life brings great reward.A response icon146A response icon146
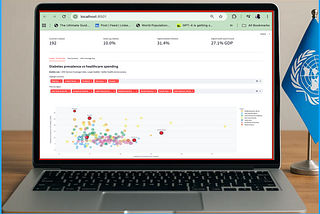
PinnedInData Storytelling CornerbyJohn Loewen, PhD·Feb 25, 2025How Python Voila Can Be Your New Killer Visualization SuperpowerCreating public dashboards with Viola and Jupyter NotebooksA response icon11A response icon11
PinnedInTowards AIbyJohn Loewen, PhD·Jan 7, 2025GPT-4o Python Charting Insanity: Prompting For Instant Data VisualsHands-on no-code visuals from the UN population projection datasetA response icon9A response icon9
PinnedInData Storytelling CornerbyJohn Loewen, PhD·Mar 19, 2024Why Data Storytelling is Your New SuperpowerBlending numbers with knowledge for effective storytellingA response icon8A response icon8
InData Storytelling CornerbyJohn Loewen, PhD·2d agoExpert Axis Scaling: How to Display Devastating World Climate DatavizPython tutorial on y-axis design decisions with global CO2 dataA response icon1A response icon1
InData Storytelling CornerbyJohn Loewen, PhD·3d agoHow To Map Ocean Plastic By Country: Shocking Results With PythonA step by step Python tutorial on visualizing ocean wasteA response icon2A response icon2
InData Storytelling CornerbyJohn Loewen, PhD·4d agoIts The Chart That Changed Energy History: Why Nobody In the World CaresA Python title generation tutorial with renewable energy dataA response icon1A response icon1
InData Storytelling CornerbyJohn Loewen, PhD·5d agoHow To With Streamlit: Correlating Hidden Statistics on World DiabetesA Python Streamlit tutorial exploring global health statisticsA response icon1A response icon1
InData Storytelling CornerbyJohn Loewen, PhD·Nov 6The Slope Chart Principle: How To Reveal Surprising Stats On 25 Years Of World UrbanizationA Python tutorial using World Bank urban population dataA response icon1A response icon1