Financial Analysis Hub — Part II

In my last blog, I covered the Validation analysis type within the Financial Analysis Hub in FCC. This post picks up where I left off, this time exploring the Financial Statement analysis type.
Let’s see how we can create a Financial Statement Analysis type.
Creating the Configuration
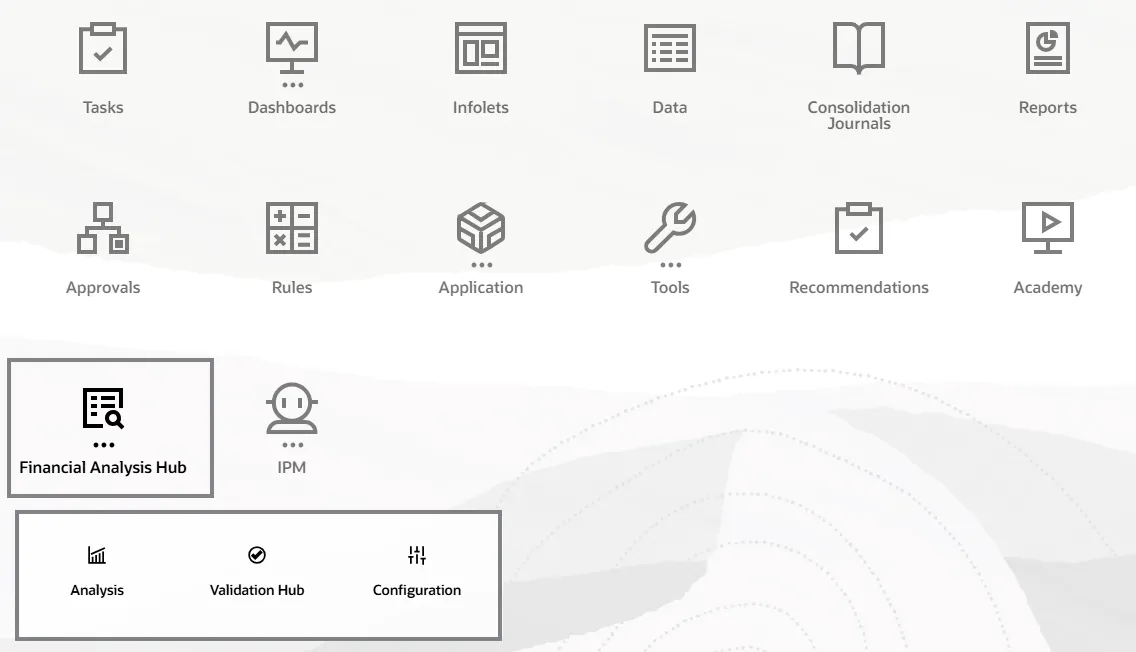
Go to the Financial Analysis Hub cluster from the Home Page and click on Configuration. This takes you to the Configuration page, where all the existing configurations are displayed. Click on Create to set up a new configuration.
Step 1: Select the Types — Provide a Name and Description for the configuration. Select Financial Statement from Analysis Type and required Financial Statement from the other list — I went with Balance Sheet. Click Next.

Step 2: Update Settings — Cube will be preselected as Consol. Select the required POV for Entity, Scenario, Period and Years.
Select the required Activity Trigger, which will trigger the generation of the analysis content. Choose an option in Time Series and then select the number of prior periods based on the selected Time Series. You need to choose at least 2 prior periods (months/quarters/half years/ Years) to generate the analysis. Click Next.

Step 3: Options — On the Options page, Anchor Dimensions and Fixed Dimensions members are provided by default for the seeded financial statement configurations. These can be changed if required.

I’ll leave the Ratios for now.
There is an option to set Exception Handling Algorithms to capture the outliers in the data set, and this is a mandatory step in Options. Two options are available here: Z-Score and MAD. Select the desired option.

Now click Save and Run. The Run Configuration page appears, set the options and click Run. The Configuration page displays the newly created Financial Statement Analysis.

Viewing the Analysis
You can view the results of the generated analysis on the Analysis page. Set the POV on the Analysis page to populate the Financial Analysis. The Analysis results are divided into two structures:
- Hierarchy Analysis
- Ratios Analysis
Hierarchy Analysis is automatically generated as a graphical Sunburst diagram, shown as part of the Analysis dashboard on the Analysis page.

This can be changed to a Sankey diagram using the Settings Action

You can select up to four nodes of a parent member in a single analysis that you want to review. Each of the nodes displays the actual data and the percentage change with respect to its parent.
Get Aparna’s stories in your inbox
Join Medium for free to get updates from this writer.
When you hover over a slice of data in the chart, you can view the Node, Value, Percentage, and Formatted Value. The Node is the member name, for example, “Accounts Receivables, Net”. The Value is the actual computed data, while Formatted Value is the value converted into thousands or millions, depending on the amount of data. Percentage is the amount you specified during configuration.

Right-click on any of the nodes, and it shows two options: Zoom In and View Node Analysis.

Use Zoom In to drill into the to next four levels of data.

You can click View Node Analysis to display a Bar chart, for example, Periodic Comparison of Accounts Receivables, Net. The Periodic comparison is based on the time series that you selected during configuration.
On the Analysis tab, when you hover over each bar in the Bar chart, it displays more details

The Explainability tab displays an explanation

After Zooming in to the detail levels, if you need to go back to the initial four nodes, click on Refresh icon.

An issue I found
As per documentation, the Key Highlights section is automatically configured as part of the dashboard to provide a quick analytical view of the selected main account balances and movements.

I tried to generate Key Highlights on this, but it failed with the following error.

It states that FCCS_Acct Receivable does not exist in the Account dimension for the specified cube or that I do not have access to it. The funny part: I tried this in an application which uses Basic Account Hierarchy type, and as we know, seeded FCCS_Acct Receivable member isn’t part of the Basic hierarchy.
This wraps up my walkthrough of the Financial Statement analysis type.
Happy Learning, and thanks for reading!