- Courses
- Tutorials
- Interview Prep
Similar Topics
Web Technologies32.1K+ articles
DSA20.4K+ articles
Python19.6K+ articles
Experiences15.8K+ articles
Interview Experiences14.5K+ articles
School Learning11.1K+ articles
JavaScript9.9K+ articles
Java9.4K+ articles
Misc7.7K+ articles
Mathematics5.7K+ articles
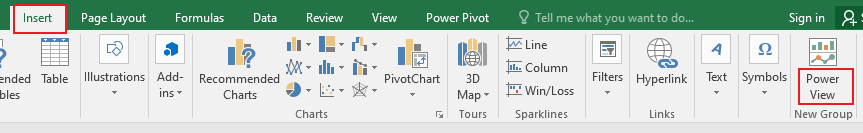
Excel-PowerView


Last Updated: 23 May 2026
Last Updated: 18 March 2026
Last Updated: 23 May 2026
Last Updated: 25 January 2023

Last Updated: 20 May 2026
Last Updated: 05 January 2023
Last Updated: 20 May 2026
Last Updated: 26 May 2026
Last Updated: 20 May 2026
Last Updated: 23 May 2026