Data Analysis Functions in Excel refer to a set of built-in functions used to analyze, summarize, and interpret data in spreadsheets. These functions help perform calculations, apply conditions, count values, and retrieve information from datasets, making it easier to extract insights and support data-driven decisions.
Power of Data Analysis Functions
At its core, data analysis involves deciphering intricate patterns, drawing meaningful conclusions, and informing critical decisions. Excel's data analysis functions serve as the building blocks for this process, allowing users to perform calculations, manipulate data, and visualize trends with ease.
Top Data Analysis Functions in Excel
Whether you are a Data analyst or someone who uses Excel for calculation or for small business, these functions are for everyone. These functions will ease your data analyst task:
1. IF Function: Automated Decision-Making
The IF function in Excel helps automate decision-making by applying logical conditions. It performs a test and returns one value if the condition is TRUE and another value if it is FALSE, making it useful for calculations and data-driven analysis.
The Formula for Using IF Function:
=IF(logical test, value if true, value if false)
.png)
2. CONCATENATE Function: Merging Data Elements
Concatenate is the easiest function to understand but the most useful one. It will combine text, numbers, and dates from multiple cells into one. This will be helpful for analyzing data and also helps at the time of creating JAVA queries.
The formula for using CONCATENATE function:
=CONCATENATE(text1,[text2], [text3]...)

3. COUNTA Function: Quantifying Non-Blank Cells
The COUNTA function counts the number of cells that are not blank, it counts a number of cells whether it contains a text, number, or an error message. But, keep in mind COUNTA function does not count empty cells.
The formula for the Non-BlankCOUNTA function :
= COUNT(value1, [value2], …)

4. DAYS Function: Calculating Time Intervals
DAYS function is used to find the number of days between two calendar dates. This is a very helpful analyzing function. Let's look at the formula.
The formula for DAYS function:
= DAYS(end_date, start_date)

5. NETWORKDAYS Function: Working Days Calculation
The NETWORKDAYS function is a date-time function used to calculate the number of working days between two calendar dates. It will exclude weekends and holidays.
The formula for DAYS function:
= DAYS(end_date, start_date)

6. SUMIFS Function: Multi-Condition Aggregation
The function will work on one or more than one condition in a given range and adds all the cell arguments that will meet the conditions.
The formula for theSUMIFS function:
= SUMIFS(sum_range, criteria_range1, criteria1, [criteria_range2, criteria2], ...)
7. AVERAGEIFS Function: Multi-Condition Averaging
The function will calculate the average of all the cells that will meet multiple conditions.
The formula for the SUMIFS function:
=AVERAGEIF (range, criteria, [average_range])

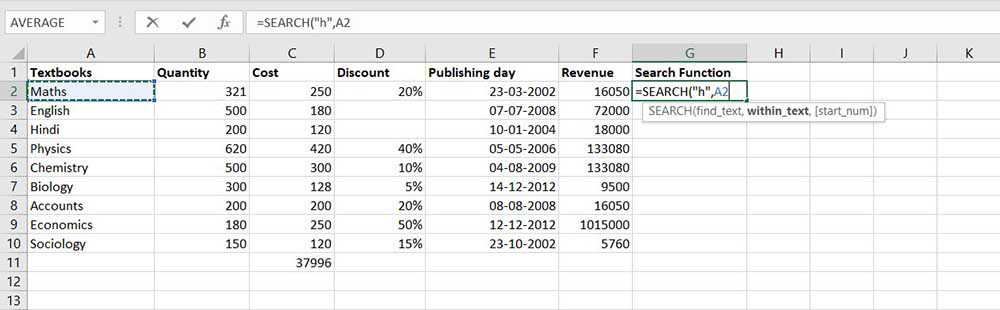
8. SEARCH Function: Navigating Extensive Datasets
This function is again a very powerful tool when you deal with big data. You can find any data entry through this function. One important thing to note there is a difference between the FIND and SEARCH functions, as FIND is used for case-sensitive matches only but SEARCH will find both types of words (capitals and small).
The formula for the SEARCH function:
=SEARCH(find_text, within_text, [start_num])
9. VLOOKUP Function: Relational Data Retrieval
Basically, the VLOOKUP function stands for Vertical Lookup, so the function will find the specific value in the column in order to return a value from a different column in the same row.
The formula for the VLOOKUP function:
= (lookup_value, table_array, col_index_num, [range_lookup])

10. COUNTIFS Function: Multi-Condition Counting
The COUNTIFS function is the most used function in Excel. The function will work on one or more than one condition in a given range and counts the cell that meets the condition.
The formula for the COUNTIFS function:
= COUNTIFS (range1, criteria1, [range2], [criteria2], ...)

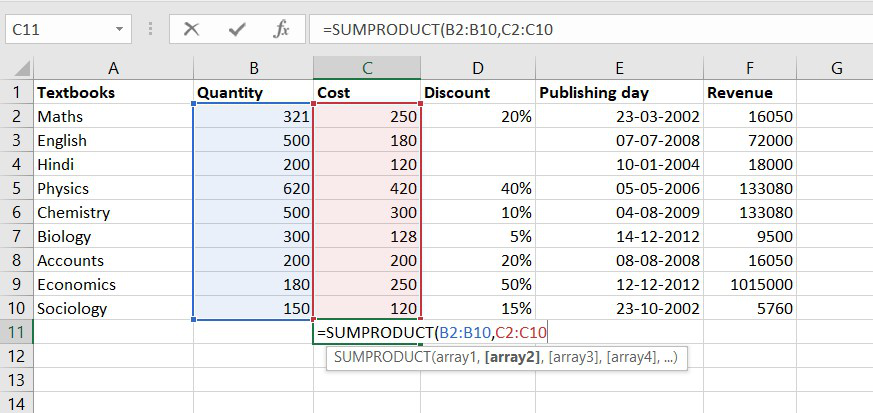
11. SUMPRODUCT Function: Multiplicative Aggregation
It is an inbuilt function in Excel, it will return the sum of products of the value given in the argument or an array. This function usually uses when you need to multiply many cells together.
The formulafor SUMPRODUCT function:
= SUMPRODUCT ( array1, [array2],[array3],...)